## Chart: Optimal Error vs. Alpha with Confidence Intervals
### Overview
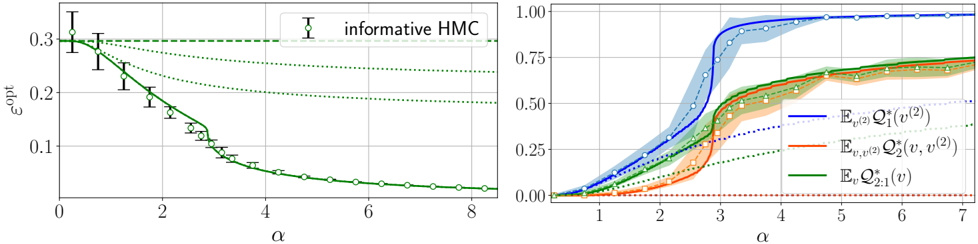
The image presents two line charts comparing the optimal error (ε<sub>opt</sub>) as a function of alpha (α) for different estimators. The left chart shows ε<sub>opt</sub> on a linear scale, while the right chart shows the cumulative distribution function (CDF) of ε<sub>opt</sub> on a logarithmic scale. Both charts include error bars representing confidence intervals.
### Components/Axes
* **X-axis (both charts):** α (Alpha) - ranging from approximately 0 to 8 on the left chart and 0 to 7 on the right chart.
* **Y-axis (left chart):** ε<sub>opt</sub> (Optimal Error) - ranging from 0 to 0.35.
* **Y-axis (right chart):** CDF (Cumulative Distribution Function) - ranging from 0 to 1.
* **Legend (right chart, top-right):**
* Blue solid line: E<sub>[μ, (σ<sup>2</sup>)<sup>2</sup>]</sub> Q<sup>2</sup>(v|σ<sup>2</sup>)
* Orange solid line: E<sub>[μ, (σ<sup>2</sup>)<sup>2</sup>]</sub> Q<sup>2</sup><sub>2</sub>(v, σ<sup>2</sup>|σ<sup>2</sup>)
* Green solid line: E<sub>[μ, σ<sup>2</sup>]</sub> Q<sup>2</sup><sub>2</sub>(v)
* **Horizontal dashed lines (both charts):** Representing baseline values, approximately 0.00, 0.25, and 0.33.
* **Title (top-center):** "informative HMC" - likely referring to the method being evaluated.
### Detailed Analysis or Content Details
**Left Chart (ε<sub>opt</sub> vs. α):**
* **Green Line (E<sub>[μ, σ<sup>2</sup>]</sub> Q<sup>2</sup><sub>2</sub>(v)):** This line starts at approximately ε<sub>opt</sub> = 0.33 at α = 0, then rapidly decreases to approximately ε<sub>opt</sub> = 0.08 at α = 2, and continues to decrease, reaching approximately ε<sub>opt</sub> = 0.03 at α = 8. The error bars decrease in size as α increases, indicating greater confidence in the estimate at higher α values.
* **Orange Line (E<sub>[μ, (σ<sup>2</sup>)<sup>2</sup>]</sub> Q<sup>2</sup><sub>2</sub>(v, σ<sup>2</sup>|σ<sup>2</sup>)):** This line starts at approximately ε<sub>opt</sub> = 0.33 at α = 0, decreases more slowly than the green line, reaching approximately ε<sub>opt</sub> = 0.15 at α = 2, and approximately ε<sub>opt</sub> = 0.07 at α = 8. The error bars are larger than those of the green line, especially at lower α values.
* **Blue Line (E<sub>[μ, (σ<sup>2</sup>)<sup>2</sup>]</sub> Q<sup>2</sup>(v|σ<sup>2</sup>)):** This line is not visible on the left chart.
**Right Chart (CDF vs. α):**
* **Blue Line (E<sub>[μ, (σ<sup>2</sup>)<sup>2</sup>]</sub> Q<sup>2</sup>(v|σ<sup>2</sup>)):** This line shows a steep increase from approximately 0.05 at α = 1 to approximately 0.75 at α = 3, and reaches approximately 0.95 at α = 6. The shaded area around the line represents the confidence interval.
* **Orange Line (E<sub>[μ, (σ<sup>2</sup>)<sup>2</sup>]</sub> Q<sup>2</sup><sub>2</sub>(v, σ<sup>2</sup>|σ<sup>2</sup>)):** This line starts at approximately 0.02 at α = 1, increases more gradually than the blue line, reaching approximately 0.65 at α = 3, and approximately 0.85 at α = 6. The shaded area is wider than that of the blue line.
* **Green Line (E<sub>[μ, σ<sup>2</sup>]</sub> Q<sup>2</sup><sub>2</sub>(v)):** This line starts at approximately 0.01 at α = 1, increases at a moderate rate, reaching approximately 0.55 at α = 3, and approximately 0.75 at α = 6. The shaded area is relatively narrow.
### Key Observations
* The green line consistently exhibits the lowest optimal error (left chart) and the highest CDF value (right chart) across the range of α values, indicating superior performance.
* As α increases, the optimal error decreases for all estimators, suggesting that increasing α improves the accuracy of the estimation.
* The confidence intervals are wider for the orange and blue lines, indicating greater uncertainty in their estimates compared to the green line.
* The CDFs show that the green estimator reaches a higher probability of achieving a low error value more quickly as α increases.
### Interpretation
The charts demonstrate the performance of three different estimators (Q<sup>2</sup>(v|σ<sup>2</sup>), Q<sup>2</sup><sub>2</sub>(v, σ<sup>2</sup>|σ<sup>2</sup>), and Q<sup>2</sup><sub>2</sub>(v)) in the context of "informative HMC". The results suggest that the estimator E<sub>[μ, σ<sup>2</sup>]</sub> Q<sup>2</sup><sub>2</sub>(v) (represented by the green line) is the most accurate and reliable, as it consistently achieves the lowest optimal error and exhibits the narrowest confidence intervals. Increasing the value of α generally improves the performance of all estimators, but the green estimator benefits the most. The horizontal dashed lines likely represent performance thresholds or benchmarks. The difference in the width of the confidence intervals suggests that the estimators E<sub>[μ, (σ<sup>2</sup>)<sup>2</sup>]</sub> Q<sup>2</sup>(v|σ<sup>2</sup>) and E<sub>[μ, (σ<sup>2</sup>)<sup>2</sup>]</sub> Q<sup>2</sup><sub>2</sub>(v, σ<sup>2</sup>|σ<sup>2</sup>) are more sensitive to variations in the data or model parameters than the estimator E<sub>[μ, σ<sup>2</sup>]</sub> Q<sup>2</sup><sub>2</sub>(v). The use of a CDF provides a more complete picture of the estimator's performance by showing the distribution of possible error values, rather than just the optimal error.