## Grouped Bar Chart: Normalized Runtime Comparison Across Benchmarks
### Overview
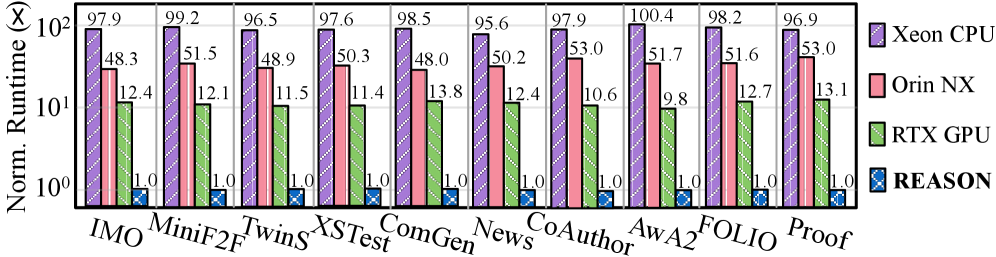
The image displays a grouped bar chart comparing the normalized runtime (in multiples) of four different computing platforms across ten distinct benchmark tasks. The chart uses a logarithmic scale on the y-axis to accommodate the wide range of values. The primary purpose is to demonstrate the relative performance efficiency of the "REASON" platform against three others: Xeon CPU, Orin NX, and RTX GPU.
### Components/Axes
* **Chart Type:** Grouped bar chart with a logarithmic y-axis.
* **Y-Axis:**
* **Label:** "Norm. Runtime (×)"
* **Scale:** Logarithmic (base 10), ranging from 10⁰ (1) to 10² (100).
* **Major Ticks:** 10⁰, 10¹, 10².
* **X-Axis:**
* **Categories (Benchmarks):** IMO, MiniF2F, TwinS, XSTest, ComGen, News, CoAuthor, Awa2, FOLIO, Proof.
* **Legend (Top-Right):**
* **Xeon CPU:** Purple bar with diagonal hatching.
* **Orin NX:** Pink bar with diagonal hatching.
* **RTX GPU:** Green bar with diagonal hatching.
* **REASON:** Blue bar with a cross-hatch pattern.
* **Data Labels:** Each bar has its numerical value printed directly above it.
### Detailed Analysis
The chart presents normalized runtime data for ten benchmarks. The "REASON" platform is the baseline, with a value of 1.0 for every benchmark. All other runtimes are expressed as multiples of this baseline.
**Data Extraction by Benchmark (Xeon CPU / Orin NX / RTX GPU / REASON):**
1. **IMO:** 97.9 / 48.3 / 12.4 / 1.0
2. **MiniF2F:** 99.2 / 51.5 / 12.1 / 1.0
3. **TwinS:** 96.5 / 48.9 / 11.5 / 1.0
4. **XSTest:** 97.6 / 50.3 / 11.4 / 1.0
5. **ComGen:** 98.5 / 48.0 / 13.8 / 1.0
6. **News:** 95.6 / 50.2 / 12.4 / 1.0
7. **CoAuthor:** 97.9 / 53.0 / 10.6 / 1.0
8. **Awa2:** 100.4 / 51.7 / 9.8 / 1.0
9. **FOLIO:** 98.2 / 51.6 / 12.7 / 1.0
10. **Proof:** 96.9 / 53.0 / 13.1 / 1.0
**Trend Verification:**
* **Xeon CPU (Purple):** Consistently the tallest bar in each group, forming a nearly flat "ceiling" across all benchmarks. Values cluster tightly between ~95.6 and 100.4.
* **Orin NX (Pink):** Consistently the second-tallest bar. Values cluster between ~48.0 and 53.0.
* **RTX GPU (Green):** Consistently the third-tallest bar. Values show slightly more variance, ranging from ~9.8 to 13.8.
* **REASON (Blue):** Consistently the shortest bar, fixed at the baseline value of 1.0 for all benchmarks.
### Key Observations
1. **Performance Hierarchy:** A strict and consistent performance hierarchy is maintained across all ten benchmarks: REASON (fastest) < RTX GPU < Orin NX < Xeon CPU (slowest).
2. **Magnitude of Difference:** The logarithmic scale highlights massive performance gaps. The Xeon CPU is approximately **two orders of magnitude (100x)** slower than the REASON baseline. The Orin NX is roughly **50x** slower, and the RTX GPU is about **10-13x** slower.
3. **Consistency:** The relative performance ratios between platforms are remarkably stable across diverse benchmark tasks (from mathematical IMO to text-based CoAuthor and FOLIO). This suggests the performance advantage of the REASON platform is robust and not task-specific.
4. **Outlier:** The "Awa2" benchmark shows the highest runtime for Xeon CPU (100.4) and the lowest for RTX GPU (9.8), slightly widening the performance gap between these two specific platforms for that task.
### Interpretation
This chart is a performance benchmark study. The data strongly suggests that the "REASON" platform (likely a specialized hardware accelerator or optimized software framework) provides a dramatic and consistent speedup over general-purpose and other specialized computing platforms for the evaluated set of tasks.
* **What it demonstrates:** The REASON system is not merely incrementally faster; it operates at a fundamentally different performance tier, completing tasks in roughly 1% of the time required by a high-end Xeon CPU. The consistency across benchmarks implies its advantage is architectural, not algorithmic.
* **Relationship between elements:** The chart is designed to make the REASON platform's advantage visually undeniable. Using it as the normalization baseline (1.0) and placing its bars at the bottom of each group creates a clear visual anchor. The logarithmic y-axis is essential; on a linear scale, the REASON and RTX GPU bars would be nearly invisible next to the Xeon CPU bars.
* **Underlying message:** The primary takeaway is the validation of the REASON platform's design. It successfully achieves a 10x to 100x reduction in runtime compared to established computing solutions across a varied workload, indicating significant potential for applications requiring high computational throughput.