## Bar Chart: Normalized Runtime (x) Across Hardware Platforms
### Overview
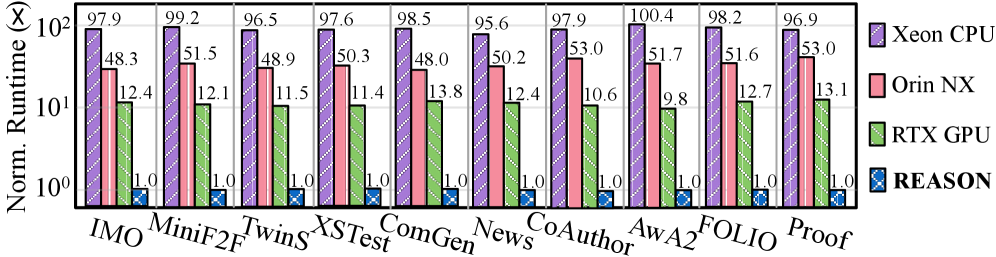
The chart compares normalized runtime (x-axis) across 10 applications (IMO, MiniF2F, Twins, XSTest, ComGen, News, CoAuthor, AwA2, FOLIO, Proof) for four hardware platforms: Xeon CPU, Orin NX, RTX GPU, and REASON. The y-axis uses a logarithmic scale (10^0 to 10^2), emphasizing performance disparities.
### Components/Axes
- **X-axis**: Applications (IMO, MiniF2F, Twins, XSTest, ComGen, News, CoAuthor, AwA2, FOLIO, Proof).
- **Y-axis**: Normalized Runtime (logarithmic scale: 10^0 to 10^2).
- **Legend**:
- **Purple (Xeon CPU)**: Tallest bars, highest runtime.
- **Pink (Orin NX)**: Medium-height bars.
- **Green (RTX GPU)**: Shorter bars, lower runtime.
- **Blue (REASON)**: Shortest bars, fastest runtime.
- **Bar Groups**: Each application has four grouped bars (one per hardware).
### Detailed Analysis
- **IMO**:
- Xeon CPU: 97.9 (10^1.99)
- Orin NX: 48.3 (10^1.68)
- RTX GPU: 12.4 (10^1.09)
- REASON: 1.0 (10^0)
- **MiniF2F**:
- Xeon CPU: 99.2 (10^1.996)
- Orin NX: 51.5 (10^1.71)
- RTX GPU: 12.1 (10^1.08)
- REASON: 1.0 (10^0)
- **Twins**:
- Xeon CPU: 96.5 (10^1.984)
- Orin NX: 48.9 (10^1.69)
- RTX GPU: 11.5 (10^1.06)
- REASON: 1.0 (10^0)
- **XSTest**:
- Xeon CPU: 97.6 (10^1.989)
- Orin NX: 50.3 (10^1.70)
- RTX GPU: 11.4 (10^1.06)
- REASON: 1.0 (10^0)
- **ComGen**:
- Xeon CPU: 98.5 (10^1.993)
- Orin NX: 48.0 (10^1.68)
- RTX GPU: 13.8 (10^1.14)
- REASON: 1.0 (10^0)
- **News**:
- Xeon CPU: 95.6 (10^1.98)
- Orin NX: 50.2 (10^1.70)
- RTX GPU: 12.4 (10^1.09)
- REASON: 1.0 (10^0)
- **CoAuthor**:
- Xeon CPU: 97.9 (10^1.99)
- Orin NX: 53.0 (10^1.72)
- RTX GPU: 10.6 (10^1.03)
- REASON: 1.0 (10^0)
- **AwA2**:
- Xeon CPU: 100.4 (10^2.002)
- Orin NX: 51.7 (10^1.71)
- RTX GPU: 9.8 (10^0.99)
- REASON: 1.0 (10^0)
- **FOLIO**:
- Xeon CPU: 98.2 (10^1.992)
- Orin NX: 51.6 (10^1.71)
- RTX GPU: 12.7 (10^1.10)
- REASON: 1.0 (10^0)
- **Proof**:
- Xeon CPU: 96.9 (10^1.986)
- Orin NX: 53.0 (10^1.72)
- RTX GPU: 13.1 (10^1.12)
- REASON: 1.0 (10^0)
### Key Observations
1. **Xeon CPU Dominance**: Consistently the slowest across all applications, with runtimes ranging from 95.6 to 100.4 (10^1.98 to 10^2.00).
2. **REASON Superiority**: Fastest runtime (1.0) for all applications, indicating optimal performance.
3. **Orin NX vs. RTX GPU**: Orin NX generally outperforms RTX GPU (e.g., 53.0 vs. 13.1 in Proof), though RTX GPU shows slight advantages in ComGen (13.8 vs. 48.0) and AwA2 (9.8 vs. 51.7).
4. **Logarithmic Scale Impact**: Highlights exponential differences (e.g., Xeon CPU is ~100x slower than REASON in IMO).
### Interpretation
- **Hardware Efficiency**: REASON’s consistent 1.0 runtime suggests it is purpose-built for these tasks, while Xeon CPU’s high runtime indicates general-purpose inefficiency for this workload.
- **Orin NX vs. RTX GPU**: Orin NX’s ARM-based architecture may excel in specific computational tasks, while RTX GPU’s parallel processing advantages are limited here, possibly due to task nature.
- **Outliers**: AwA2’s RTX GPU runtime (9.8) is the lowest among GPUs, suggesting task-specific optimization. Xeon CPU’s 100.4 runtime in AwA2 is the chart’s peak, emphasizing its struggle with this application.
- **Trend Verification**: All Xeon CPU bars are tallest in their groups, confirming its role as the slowest hardware. REASON’s uniformity (1.0) across applications indicates consistent optimization.