# Technical Document Extraction: Scatter Plot Analysis
## Overview
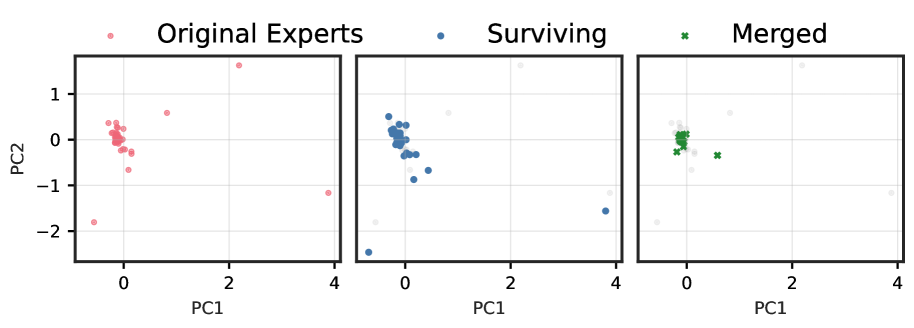
The image contains three scatter plots arranged horizontally, each representing different data groupings. The plots share identical axis labels (PC1 and PC2) and scales, suggesting a consistent dimensionality reduction or feature space representation.
---
### **1. Original Experts**
- **Title**: "Original Experts"
- **Data Points**:
- **Color**: Pink (`#FF69B4`)
- **Distribution**: Clustered primarily in the lower-left quadrant (PC1: 0–1, PC2: -1–1).
- **Outliers**: Two points at (PC1: ~2.5, PC2: ~1.5) and (PC1: ~-2, PC2: ~-2).
- **Axis Labels**:
- X-axis: `PC1` (range: -2 to 4)
- Y-axis: `PC2` (range: -2 to 1)
---
### **2. Surviving**
- **Title**: "Surviving"
- **Data Points**:
- **Color**: Blue (`#1E90FF`)
- **Distribution**: Clustered in the lower-left quadrant (PC1: 0–1, PC2: -1–1), with a secondary cluster near (PC1: 3, PC2: 0.5).
- **Outliers**: One point at (PC1: ~-1, PC2: ~-2) and one at (PC1: ~2.5, PC2: ~-1.5).
- **Axis Labels**:
- X-axis: `PC1` (range: -2 to 4)
- Y-axis: `PC2` (range: -2 to 1)
---
### **3. Merged**
- **Title**: "Merged"
- **Data Points**:
- **Color**: Green (`#32CD32`)
- **Distribution**: Clustered tightly around the origin (PC1: 0–1, PC2: -0.5–0.5).
- **Overlap**: Green points partially overlap with the "Original Experts" cluster.
- **Axis Labels**:
- X-axis: `PC1` (range: -2 to 4)
- Y-axis: `PC2` (range: -2 to 1)
---
### **Legend**
- **Categories**:
- `Original Experts`: Pink circles (`●`)
- `Surviving`: Blue circles (`●`)
- `Merged`: Green crosses (`✖`)
---
### **Key Observations**
1. **Dimensionality**: All plots use the same 2D principal component space (PC1 and PC2).
2. **Clustering**:
- "Original Experts" and "Merged" show overlapping clusters near the origin.
- "Surviving" exhibits a broader distribution with distinct secondary clusters.
3. **Outliers**:
- "Original Experts" and "Surviving" contain outliers in the upper-right and lower-left quadrants.
- "Merged" has no visible outliers.
4. **Noise**: White dots in "Surviving" and "Merged" plots may represent noise or unclassified data points.
---
### **Technical Notes**
- **Gridlines**: Present in all plots for reference.
- **Scale Consistency**: Uniform axis ranges across all plots enable direct comparison.
- **Data Representation**: Scatter plots use distinct markers (circles vs. crosses) to differentiate categories.