## Line Chart: ECE vs. Number Explanations
### Overview
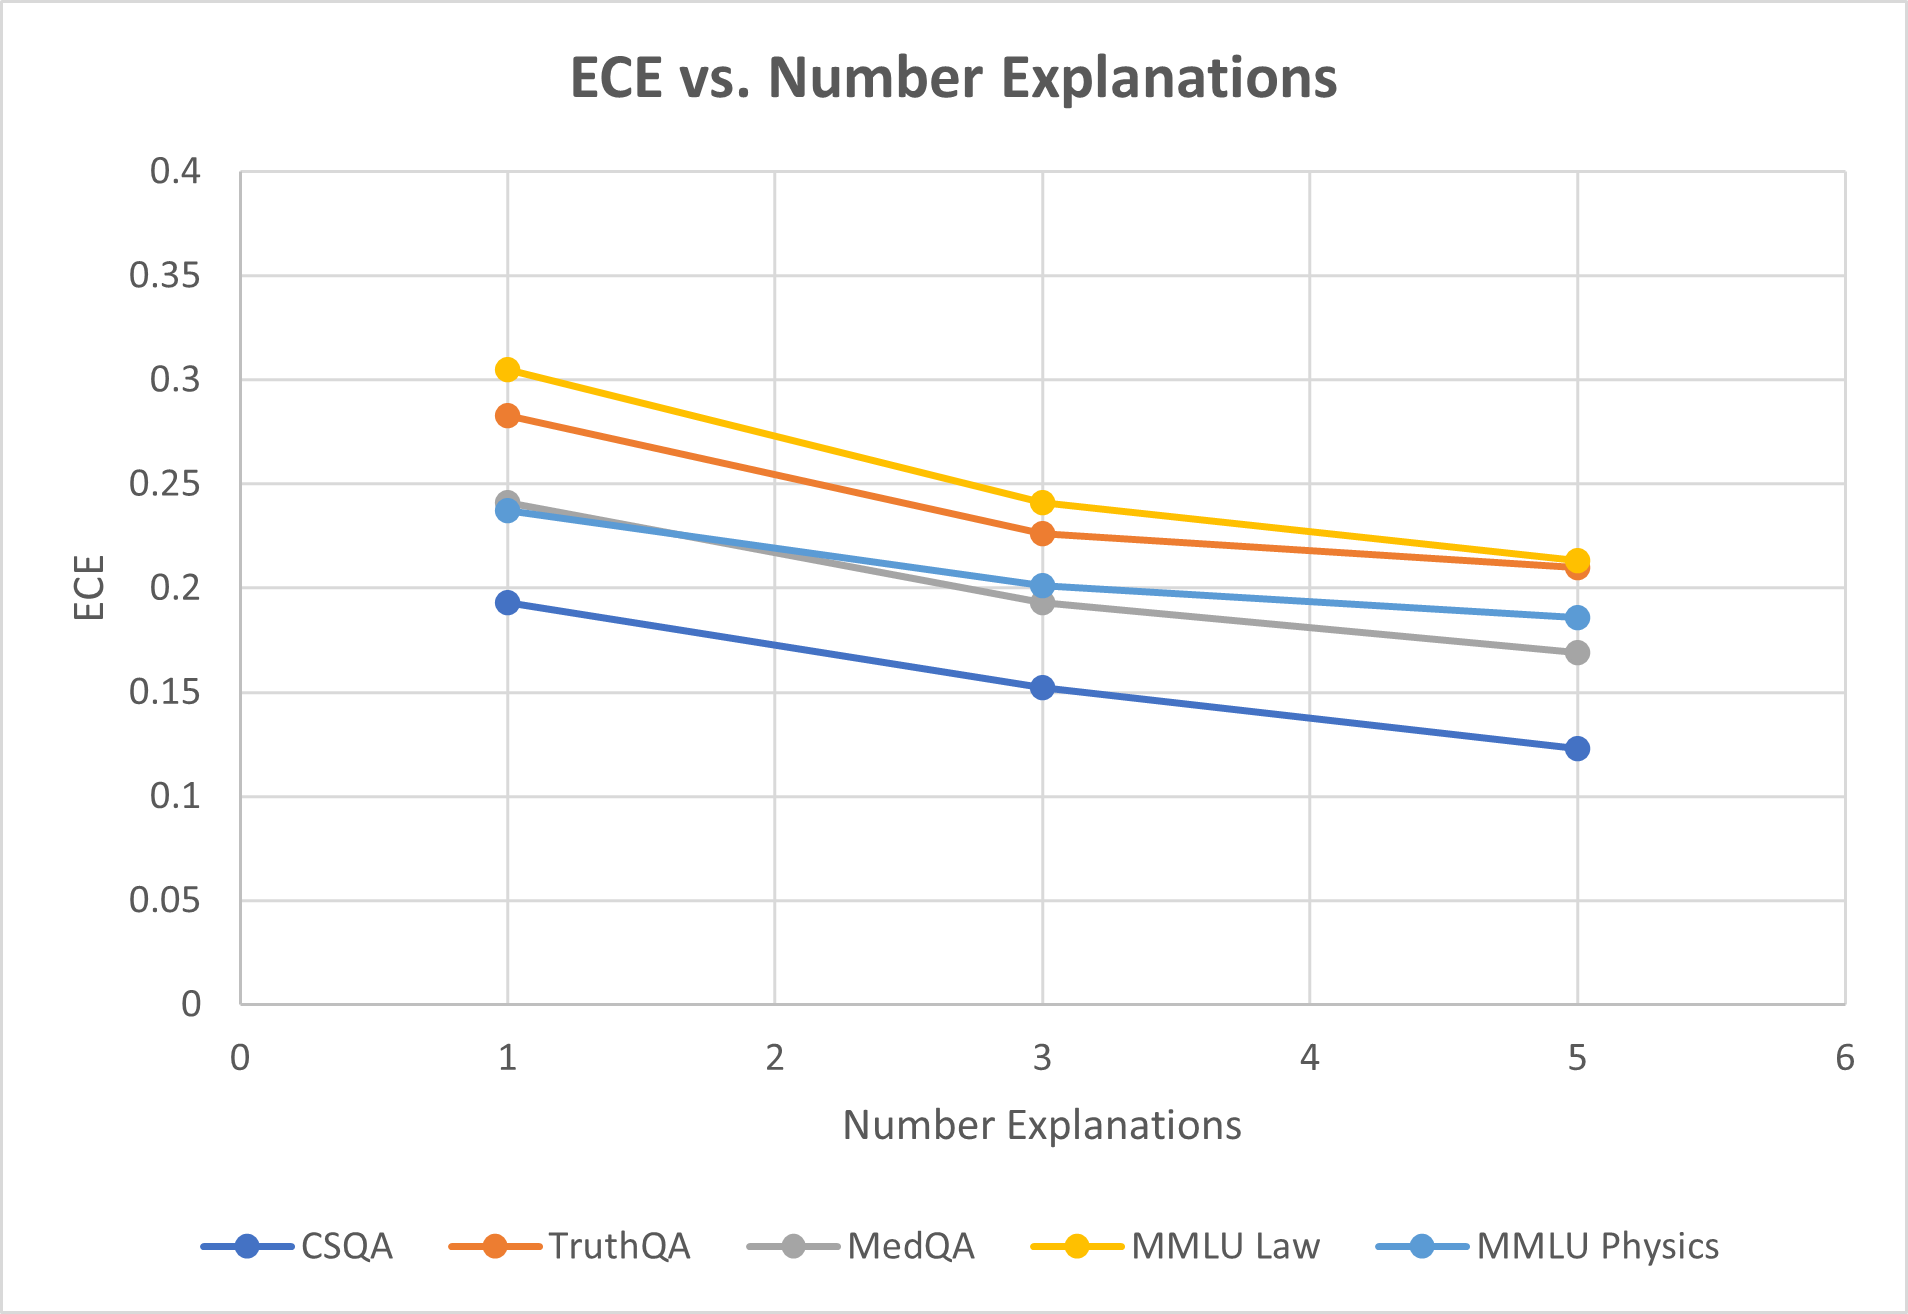
The image is a line chart comparing the Expected Calibration Error (ECE) against the number of explanations provided for different question-answering datasets. The chart includes five datasets: CSQA, TruthQA, MedQA, MMLU Law, and MMLU Physics. The x-axis represents the number of explanations, ranging from 0 to 6, and the y-axis represents the ECE, ranging from 0 to 0.4.
### Components/Axes
* **Title:** ECE vs. Number Explanations
* **X-axis:**
* Label: Number Explanations
* Scale: 0 to 6, with tick marks at each integer value.
* **Y-axis:**
* Label: ECE
* Scale: 0 to 0.4, with tick marks at intervals of 0.05.
* **Legend:** Located at the bottom of the chart, it identifies each dataset by color:
* Blue: CSQA
* Orange: TruthQA
* Gray: MedQA
* Yellow: MMLU Law
* Light Blue: MMLU Physics
### Detailed Analysis
Here's a breakdown of each data series:
* **CSQA (Blue):** The line slopes downward.
* 1 Explanation: ECE ≈ 0.19
* 3 Explanations: ECE ≈ 0.15
* 5 Explanations: ECE ≈ 0.12
* **TruthQA (Orange):** The line slopes downward.
* 1 Explanation: ECE ≈ 0.28
* 3 Explanations: ECE ≈ 0.24
* 5 Explanations: ECE ≈ 0.21
* **MedQA (Gray):** The line is relatively flat, with a slight downward slope.
* 1 Explanation: ECE ≈ 0.24
* 3 Explanations: ECE ≈ 0.20
* 5 Explanations: ECE ≈ 0.17
* **MMLU Law (Yellow):** The line slopes downward.
* 1 Explanation: ECE ≈ 0.30
* 3 Explanations: ECE ≈ 0.25
* 5 Explanations: ECE ≈ 0.22
* **MMLU Physics (Light Blue):** The line is relatively flat, with a slight downward slope.
* 1 Explanation: ECE ≈ 0.24
* 3 Explanations: ECE ≈ 0.20
* 5 Explanations: ECE ≈ 0.18
### Key Observations
* All datasets show a decrease in ECE as the number of explanations increases, although the magnitude of the decrease varies.
* MMLU Law generally has the highest ECE across all numbers of explanations.
* CSQA generally has the lowest ECE across all numbers of explanations.
* The ECE for MedQA and MMLU Physics are very similar.
### Interpretation
The chart suggests that providing more explanations generally reduces the Expected Calibration Error (ECE) for question-answering models across different datasets. This indicates that the models become better calibrated (i.e., their confidence in their answers aligns more closely with their accuracy) as they provide more explanations. The different levels of ECE across datasets likely reflect the varying difficulty and characteristics of the questions in each dataset. The fact that the ECE decreases with more explanations suggests that the models are able to refine their understanding and improve their calibration as they generate more reasoning steps.