## Line Chart: ECE vs. Number Explanations
### Overview
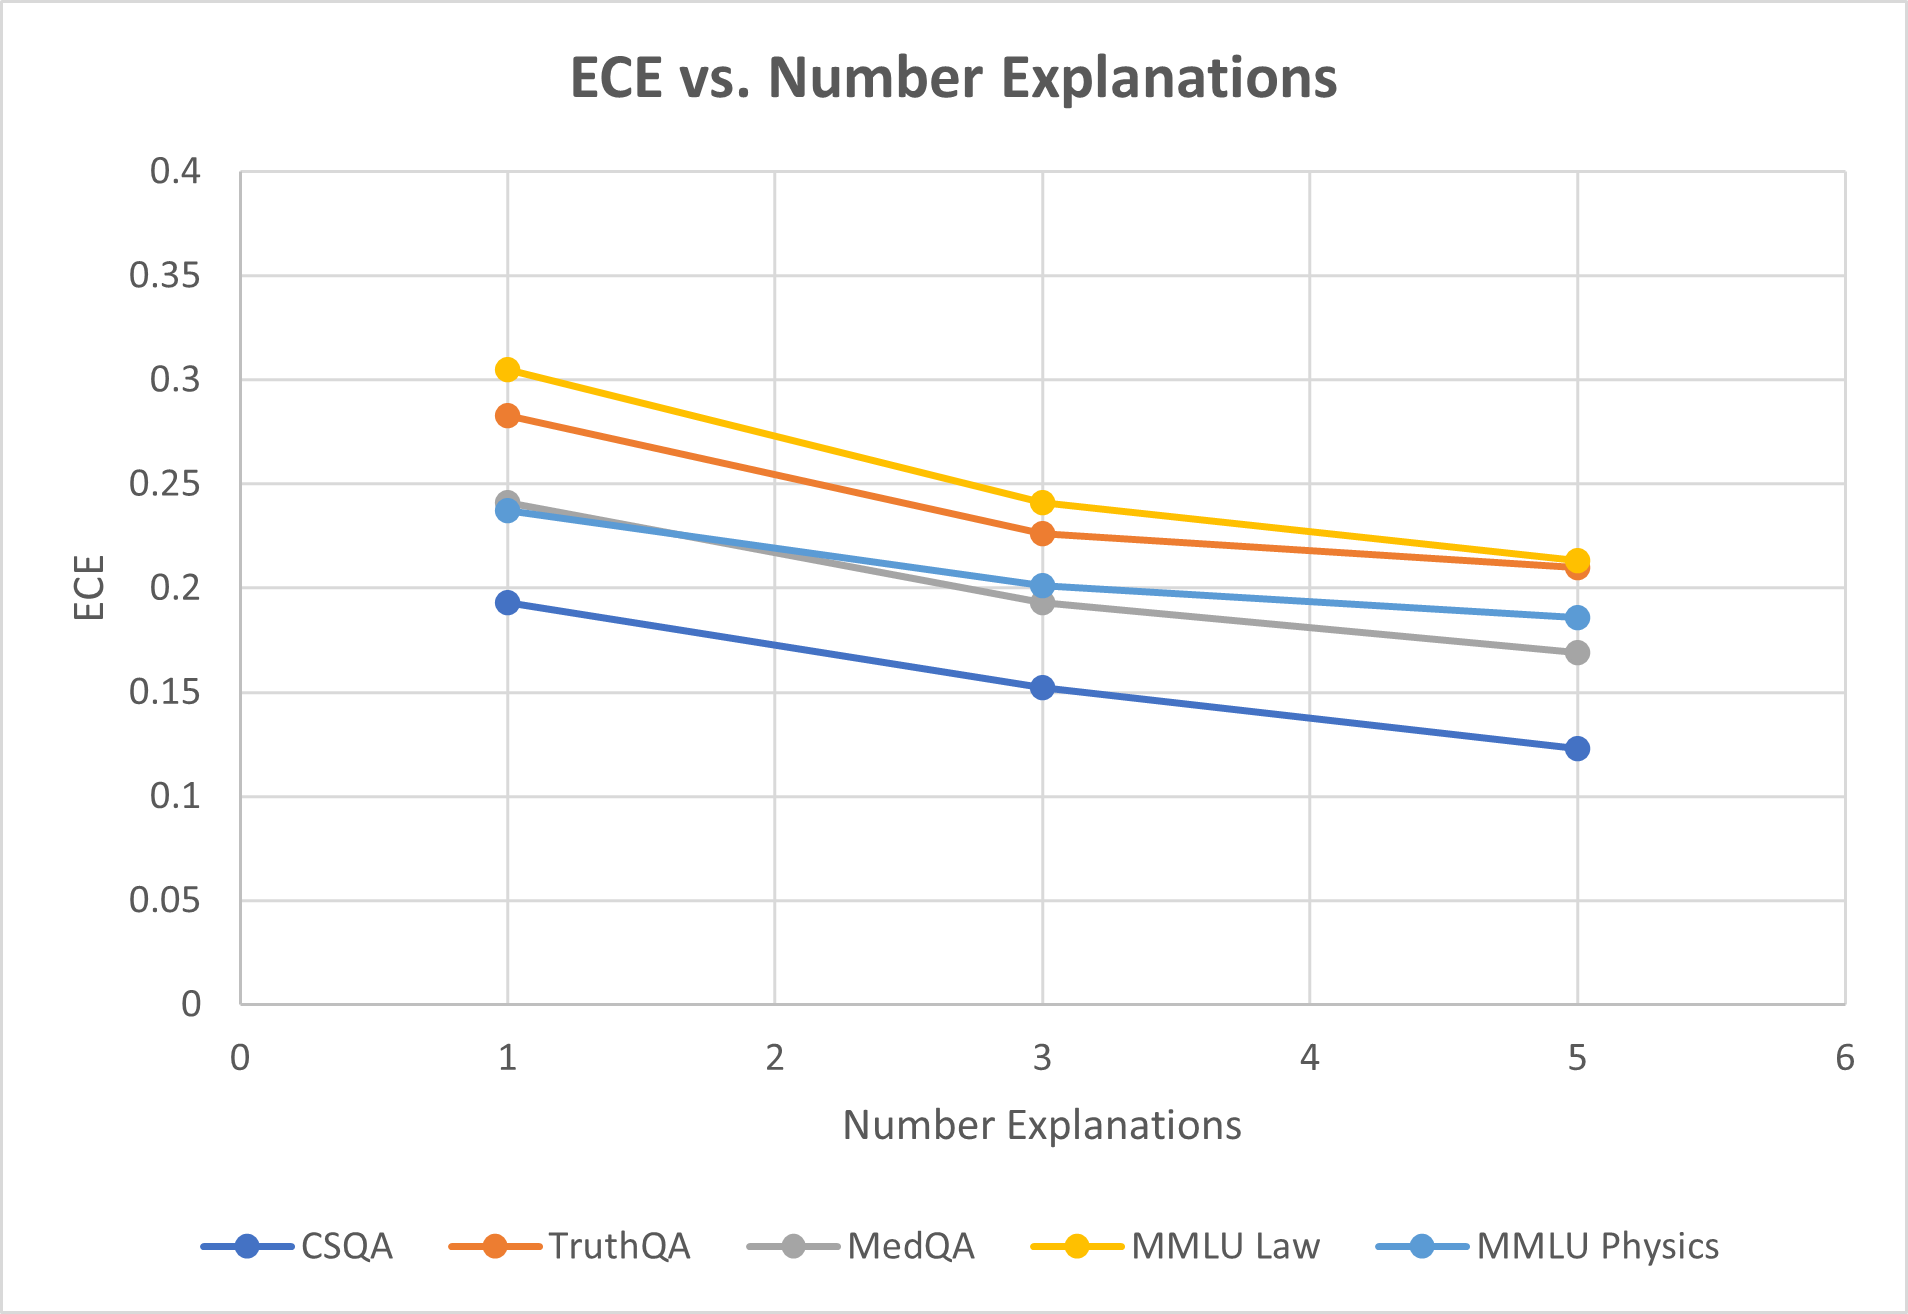
The chart visualizes the relationship between Explanation Consistency Error (ECE) and the number of explanations provided across five evaluation frameworks. ECE decreases as the number of explanations increases, with varying rates of decline across frameworks.
### Components/Axes
- **X-axis**: "Number Explanations" (0–6, integer increments)
- **Y-axis**: "ECE" (0–0.4, 0.05 increments)
- **Legend**: Located at the bottom, mapping colors to frameworks:
- Blue: CSQA
- Orange: TruthQA
- Gray: MedQA
- Yellow: MMLU Law
- Cyan: MMLU Physics
### Detailed Analysis
1. **CSQA (Blue Line)**:
- Starts at ~0.19 ECE at 1 explanation.
- Declines steadily to ~0.12 ECE at 5 explanations.
- Slope: Steepest decline among all frameworks.
2. **TruthQA (Orange Line)**:
- Begins at ~0.28 ECE at 1 explanation.
- Drops to ~0.21 ECE at 5 explanations.
- Slope: Moderate decline, less steep than CSQA.
3. **MedQA (Gray Line)**:
- Starts at ~0.24 ECE at 1 explanation.
- Decreases to ~0.17 ECE at 5 explanations.
- Slope: Gradual decline, intermediate between CSQA and TruthQA.
4. **MMLU Law (Yellow Line)**:
- Begins at ~0.30 ECE at 1 explanation.
- Reduces to ~0.21 ECE at 5 explanations.
- Slope: Gradual decline, similar to TruthQA but higher baseline.
5. **MMLU Physics (Cyan Line)**:
- Starts at ~0.24 ECE at 1 explanation.
- Drops to ~0.18 ECE at 5 explanations.
- Slope: Moderate decline, comparable to MedQA.
### Key Observations
- **Universal Trend**: All frameworks show decreasing ECE with more explanations, indicating improved performance.
- **CSQA Dominance**: CSQA achieves the lowest ECE at all explanation counts, suggesting superior sensitivity to explanation quality.
- **Convergence**: Lines converge toward lower ECE values as explanations increase, implying diminishing returns after ~5 explanations.
- **MMLU Law Anomaly**: Maintains the highest ECE baseline but shows significant improvement, closing the gap with other frameworks by 5 explanations.
### Interpretation
The data demonstrates that increasing the number of explanations generally enhances explanation consistency across frameworks. CSQA’s steep decline highlights its effectiveness in leveraging additional explanations, while MMLU Law’s higher baseline suggests inherent challenges in legal text evaluation. The convergence pattern implies that beyond ~5 explanations, further gains in ECE become marginal. This trend underscores the importance of balancing explanation quantity with quality, as excessive explanations may not proportionally improve consistency metrics.