## Line Graphs: Pre-training and Fine-tuning Masking Performance
### Overview
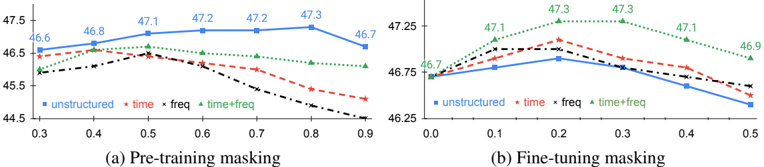
The image contains two line graphs comparing the performance of different masking strategies during pre-training and fine-tuning phases. Each graph shows four data series (unstructured, time, freq, time+freq) plotted against varying masking ratios. Performance is measured in percentage on the y-axis, while masking ratios are on the x-axis.
### Components/Axes
**Graph (a): Pre-training Masking**
- **X-axis**: Pre-training masking ratio (0.3 to 0.9)
- **Y-axis**: Performance (%) (44.5 to 47.5)
- **Legend**:
- Blue squares: Unstructured
- Red stars: Time
- Black crosses: Freq
- Green triangles: Time+freq
**Graph (b): Fine-tuning Masking**
- **X-axis**: Fine-tuning masking ratio (0.0 to 0.5)
- **Y-axis**: Performance (%) (46.25 to 47.25)
- **Legend**: Same as (a)
### Detailed Analysis
**Graph (a) Trends**:
1. **Unstructured (blue)**: Starts at 46.6, peaks at 47.3 (0.7 masking), then declines to 46.7.
2. **Time (red)**: Starts at 46.6, peaks at 46.8 (0.4 masking), then declines to 45.5.
3. **Freq (black)**: Starts at 45.8, peaks at 46.5 (0.5 masking), then declines to 45.0.
4. **Time+freq (green)**: Starts at 46.3, peaks at 46.8 (0.4 masking), then declines to 46.3.
**Graph (b) Trends**:
1. **Unstructured (blue)**: Starts at 46.7, peaks at 47.1 (0.1 masking), then declines to 46.9.
2. **Time (red)**: Starts at 46.7, peaks at 47.3 (0.2 masking), then declines to 46.6.
3. **Freq (black)**: Starts at 46.7, peaks at 47.1 (0.1 masking), then declines to 46.5.
4. **Time+freq (green)**: Starts at 46.7, peaks at 47.3 (0.2 masking), then declines to 46.9.
### Key Observations
1. **Pre-training Masking**:
- Time+freq achieves the highest peak (47.3) at 0.7 masking.
- Unstructured masking outperforms others initially but drops sharply after 0.7.
- Freq masking shows the steepest decline post-peak.
2. **Fine-tuning Masking**:
- Time+freq maintains the highest performance (47.3) at 0.2 masking.
- All strategies show performance drops after their respective peaks.
- Unstructured masking declines more sharply than others.
### Interpretation
- **Optimal Masking Strategy**: Time+freq consistently outperforms other strategies in both phases, suggesting that combining temporal and frequency-based masking is most effective.
- **Performance Peaks**: Both graphs show performance peaks at intermediate masking ratios (0.4–0.7 for pre-training, 0.1–0.2 for fine-tuning), indicating diminishing returns at higher masking ratios.
- **Unstructured Masking**: While competitive in pre-training, its sharp decline in fine-tuning suggests it may overfit or lack adaptability during later stages.
- **Anomalies**: Freq masking underperforms in pre-training but matches time+freq in fine-tuning, hinting at context-dependent efficacy.
The data implies that hybrid masking strategies (time+freq) balance exploration and exploitation better than single-axis approaches, though further analysis is needed to explain the performance drops at higher masking ratios.