TECHNICAL ASSET FINGERPRINT
6d86dbdff64bdb4155df9550
Click to view fullscreen
Press ESC or click to close
FOUND IN PAPERS
EXPERT: gemma-3-27b-it-free VERSION 1
RUNTIME: google-free/gemma-3-27b-it
INTEL_VERIFIED
## Chart: Ma@K Accuracy vs. K for Different Models
### Overview
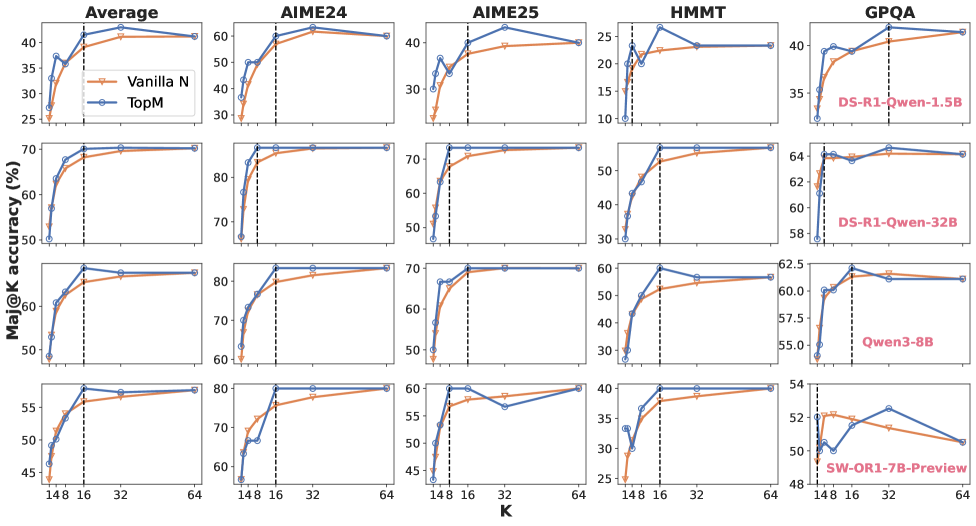
The image presents a series of line charts comparing the Ma@K accuracy (Mean Average Precision at K) of different language models (Vanilla N, TopM, DS-R1-Owen-1.5B, DS-R1-Qwen-32B, Qwen3-8B, SW-OR1-7B-Preview) across varying values of K (148, 16, 32, 64). The charts are arranged in a 4x5 grid, with the first column representing an "Average" across all models, and the subsequent columns representing individual datasets: AIME24, AIME25, HMMT, and GPQA. Each chart displays multiple lines representing different models or configurations.
### Components/Axes
* **X-axis:** K (Values: 148, 16, 32, 64). Labeled as "K".
* **Y-axis:** Ma@K accuracy (%). Labeled as "Ma@K accuracy (%)". The scale varies between charts, ranging from approximately 10% to 80%.
* **Legend:** Located in the top-left corner of each chart.
* Vanilla N (Orange Line)
* TopM (Blue Line)
* DS-R1-Owen-1.5B (Red Line) - Only present in the GPQA chart.
* DS-R1-Qwen-32B (Blue Line) - Only present in the GPQA chart.
* Qwen3-8B (Black Line) - Only present in the GPQA chart.
* SW-OR1-7B-Preview (Red Line) - Only present in the GPQA chart.
* **Charts:** Arranged in a 4x5 grid.
* Row 1: Average, AIME24, AIME25, HMMT, GPQA
* Row 2: Average, AIME24, AIME25, HMMT, GPQA
* Row 3: Average, AIME24, AIME25, HMMT, GPQA
* Row 4: Average, AIME24, AIME25, HMMT, GPQA
### Detailed Analysis or Content Details
**Average Charts:**
* **Top Row:** TopM (blue) starts at approximately 30% and increases steadily to around 40% as K decreases. Vanilla N (orange) starts at approximately 30% and increases to around 35% as K decreases.
* **Second Row:** TopM (blue) starts at approximately 65% and remains relatively stable around 70% as K decreases. Vanilla N (orange) starts at approximately 50% and increases to around 70% as K decreases.
* **Third Row:** TopM (blue) starts at approximately 50% and increases to around 60% as K decreases. Vanilla N (orange) starts at approximately 45% and increases to around 60% as K decreases.
* **Bottom Row:** TopM (blue) starts at approximately 50% and remains relatively stable around 55% as K decreases. Vanilla N (orange) starts at approximately 50% and remains relatively stable around 50% as K decreases.
**AIME24 Charts:**
* **Top Row:** TopM (blue) starts at approximately 55% and increases to around 65% as K decreases. Vanilla N (orange) starts at approximately 55% and increases to around 65% as K decreases.
* **Second Row:** TopM (blue) starts at approximately 75% and remains relatively stable around 80% as K decreases. Vanilla N (orange) starts at approximately 65% and increases to around 80% as K decreases.
* **Third Row:** TopM (blue) starts at approximately 75% and remains relatively stable around 80% as K decreases. Vanilla N (orange) starts at approximately 65% and increases to around 80% as K decreases.
* **Bottom Row:** TopM (blue) starts at approximately 75% and remains relatively stable around 80% as K decreases. Vanilla N (orange) starts at approximately 65% and increases to around 80% as K decreases.
**AIME25 Charts:**
* **Top Row:** TopM (blue) starts at approximately 35% and increases to around 45% as K decreases. Vanilla N (orange) starts at approximately 35% and increases to around 45% as K decreases.
* **Second Row:** TopM (blue) starts at approximately 65% and remains relatively stable around 75% as K decreases. Vanilla N (orange) starts at approximately 55% and increases to around 75% as K decreases.
* **Third Row:** TopM (blue) starts at approximately 65% and remains relatively stable around 75% as K decreases. Vanilla N (orange) starts at approximately 55% and increases to around 75% as K decreases.
* **Bottom Row:** TopM (blue) starts at approximately 65% and remains relatively stable around 75% as K decreases. Vanilla N (orange) starts at approximately 55% and increases to around 75% as K decreases.
**HMMT Charts:**
* **Top Row:** TopM (blue) starts at approximately 15% and increases to around 25% as K decreases. Vanilla N (orange) starts at approximately 15% and increases to around 25% as K decreases.
* **Second Row:** TopM (blue) starts at approximately 40% and increases to around 50% as K decreases. Vanilla N (orange) starts at approximately 30% and increases to around 50% as K decreases.
* **Third Row:** TopM (blue) starts at approximately 35% and increases to around 45% as K decreases. Vanilla N (orange) starts at approximately 30% and increases to around 45% as K decreases.
* **Bottom Row:** TopM (blue) starts at approximately 30% and increases to around 35% as K decreases. Vanilla N (orange) starts at approximately 25% and increases to around 35% as K decreases.
**GPQA Charts:**
* **Top Row:** DS-R1-Owen-1.5B (red) starts at approximately 30% and increases to around 35% as K decreases. TopM (blue) starts at approximately 35% and remains relatively stable around 40% as K decreases.
* **Second Row:** DS-R1-Qwen-32B (blue) starts at approximately 55% and increases to around 62% as K decreases. TopM (blue) starts at approximately 60% and remains relatively stable around 64% as K decreases.
* **Third Row:** Qwen3-8B (black) starts at approximately 55% and increases to around 62% as K decreases. TopM (blue) starts at approximately 60% and remains relatively stable around 64% as K decreases.
* **Bottom Row:** SW-OR1-7B-Preview (red) starts at approximately 48% and increases to around 54% as K decreases. TopM (blue) starts at approximately 50% and remains relatively stable around 54% as K decreases.
### Key Observations
* Generally, Ma@K accuracy increases as K decreases across all models and datasets.
* TopM consistently outperforms Vanilla N in most datasets, especially at lower values of K.
* The HMMT dataset shows the lowest overall accuracy compared to other datasets.
* The GPQA dataset exhibits the highest accuracy, with some models exceeding 60%.
* The performance differences between models are more pronounced at lower values of K.
### Interpretation
The charts demonstrate the impact of the 'K' parameter on the Ma@K accuracy of different language models across various datasets. A lower 'K' value implies a more precise ranking, and the increasing accuracy as 'K' decreases suggests that these models are better at identifying the most relevant results when fewer options are considered. The consistent outperformance of TopM over Vanilla N indicates that the TopM approach (likely involving some form of filtering or ranking) is more effective at retrieving relevant information. The dataset-specific variations in accuracy highlight the models' sensitivity to the characteristics of the data. The lower accuracy on HMMT suggests that this dataset presents a greater challenge for these models, potentially due to its complexity or the nature of the questions. The GPQA dataset, with its higher accuracy scores, may be more aligned with the models' training data or have simpler question-answering requirements. The observed trends suggest that optimizing the 'K' parameter is crucial for maximizing the performance of these language models in information retrieval tasks. The differences in performance between models on GPQA suggest that model size and architecture play a significant role in achieving high accuracy on this dataset.
DECODING INTELLIGENCE...