## Multi-Panel Line Chart: Model Accuracy Comparison (Maj@K)
### Overview
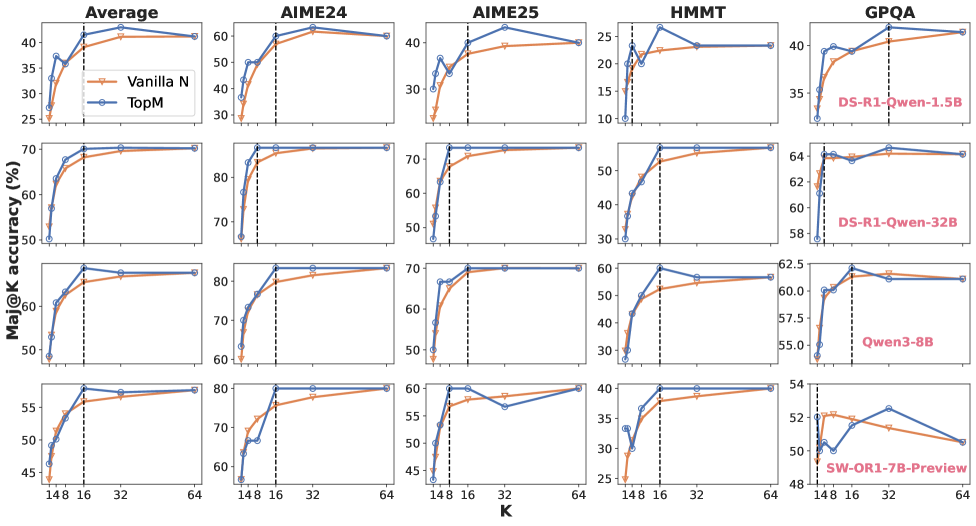
The image is a grid of 20 line charts arranged in 4 rows and 5 columns. It compares the performance of two methods, "Vanilla N" and "TopM," across four different AI models and five different evaluation datasets. The performance metric is "Maj@K accuracy (%)" plotted against the parameter "K." The charts show how accuracy changes as K increases from 1 to 64.
### Components/Axes
* **Chart Type:** Multi-panel line chart (4x5 grid).
* **Y-Axis (All Charts):** Label: `Maj@K accuracy (%)`. Scale varies per row (model) and column (dataset), but all are linear percentage scales.
* **X-Axis (All Charts):** Label: `K`. Discrete markers at values: 1, 4, 8, 16, 32, 64. A vertical dashed black line is consistently placed at K=16 across all charts.
* **Legend:** Located in the top-left chart ("Average" for the first model). It defines two data series:
* `Vanilla N`: Orange line with circular markers.
* `TopM`: Blue line with diamond markers.
* **Row Labels (Model Names):** Positioned on the far right of each row, written in red text.
* Row 1: `DS-R1-Qwen-1.5B`
* Row 2: `DS-R1-Qwen-32B`
* Row 3: `Qwen3-8B`
* Row 4: `SW-OR1-7B-Preview`
* **Column Labels (Dataset Names):** Positioned at the top of each column.
* Column 1: `Average`
* Column 2: `AIME24`
* Column 3: `AIME25`
* Column 4: `HMMT`
* Column 5: `GPQA`
### Detailed Analysis
Data points are estimated from the grid lines. The vertical dashed line at K=16 is a key reference point.
**Row 1: DS-R1-Qwen-1.5B**
* **Average:** Both lines rise sharply from K=1 to K=8. TopM (blue) consistently leads Vanilla N (orange). At K=16, TopM ~40%, Vanilla N ~38%. Both plateau near 40% by K=64.
* **AIME24:** Steep rise to K=8. TopM leads. At K=16, TopM ~60%, Vanilla N ~58%. Both plateau near 60%.
* **AIME25:** Similar trend. At K=16, TopM ~40%, Vanilla N ~38%. Plateau near 40%.
* **HMMT:** Lower overall accuracy. At K=16, TopM ~25%, Vanilla N ~22%. Plateau near 25%.
* **GPQA:** At K=16, TopM ~40%, Vanilla N ~38%. Plateau near 40%.
**Row 2: DS-R1-Qwen-32B**
* **Average:** Very high accuracy. At K=16, TopM ~70%, Vanilla N ~68%. Both plateau near 70%.
* **AIME24:** At K=16, TopM ~85%, Vanilla N ~83%. Plateau near 85%.
* **AIME25:** At K=16, TopM ~70%, Vanilla N ~68%. Plateau near 70%.
* **HMMT:** At K=16, TopM ~55%, Vanilla N ~52%. Plateau near 55%.
* **GPQA:** At K=16, TopM ~64%, Vanilla N ~63%. Plateau near 64%.
**Row 3: Qwen3-8B**
* **Average:** At K=16, TopM ~80%, Vanilla N ~78%. Plateau near 80%.
* **AIME24:** At K=16, TopM ~85%, Vanilla N ~83%. Plateau near 85%.
* **AIME25:** At K=16, TopM ~70%, Vanilla N ~68%. Plateau near 70%.
* **HMMT:** At K=16, TopM ~60%, Vanilla N ~55%. Plateau near 60%.
* **GPQA:** At K=16, TopM ~62.5%, Vanilla N ~61%. Plateau near 62.5%.
**Row 4: SW-OR1-7B-Preview**
* **Average:** At K=16, TopM ~57%, Vanilla N ~55%. Plateau near 57%.
* **AIME24:** At K=16, TopM ~75%, Vanilla N ~73%. Plateau near 75%.
* **AIME25:** **Anomaly:** TopM dips at K=32 (~56%) before recovering. At K=16, TopM ~60%, Vanilla N ~58%. Both end near 60%.
* **HMMT:** At K=16, TopM ~40%, Vanilla N ~38%. Plateau near 40%.
* **GPQA:** **Anomaly:** Both lines show a peak at K=16 followed by a decline. At K=16, TopM ~53%, Vanilla N ~52%. By K=64, both drop to ~50%.
### Key Observations
1. **Consistent Superiority of TopM:** In 19 out of 20 charts, the blue "TopM" line is at or above the orange "Vanilla N" line for all values of K.
2. **Diminishing Returns:** Accuracy for both methods increases rapidly from K=1 to K=8 or K=16, then plateaus. The vertical dashed line at K=16 often marks the beginning of this plateau.
3. **Model Performance Hierarchy:** The DS-R1-Qwen-32B (Row 2) and Qwen3-8B (Row 3) models achieve the highest absolute accuracy scores across most datasets. The DS-R1-Qwen-1.5B (Row 1) and SW-OR1-7B-Preview (Row 4) show lower overall performance.
4. **Dataset Difficulty:** HMMT appears to be the most challenging dataset, yielding the lowest accuracy percentages for all models. AIME24 and AIME25 show similar, mid-range difficulty.
5. **Notable Anomalies:**
* **SW-OR1-7B-Preview on AIME25:** The TopM series shows an unusual dip at K=32.
* **SW-OR1-7B-Preview on GPQA:** Both methods show a clear performance peak at K=16 followed by a significant decline as K increases to 64, which is contrary to the plateau trend seen elsewhere.
### Interpretation
This visualization demonstrates the effectiveness of the "TopM" method over "Vanilla N" for improving the Maj@K accuracy of various language models on mathematical and reasoning benchmarks (AIME, HMMT, GPQA). The consistent lead of the blue line suggests TopM is a more robust strategy for leveraging multiple samples (K).
The plateau after K=16 indicates that for these tasks and models, generating more than 16-32 candidate solutions provides little to no additional benefit for majority voting accuracy. This is a crucial efficiency insight, suggesting computational resources can be optimized by limiting K.
The performance hierarchy between models is clear, with larger or more specialized models (like DS-R1-Qwen-32B) dominating. The anomalies in the SW-OR1-7B-Preview model's results, particularly the decline on GPQA at high K, may indicate issues with sample quality or diversity for that specific model-dataset combination, where additional samples introduce more noise than signal. The charts provide a clear, comparative snapshot of method efficacy and scaling behavior across different model architectures and task difficulties.