## Line Graph: Mean@K Accuracy Comparison Across Datasets
### Overview
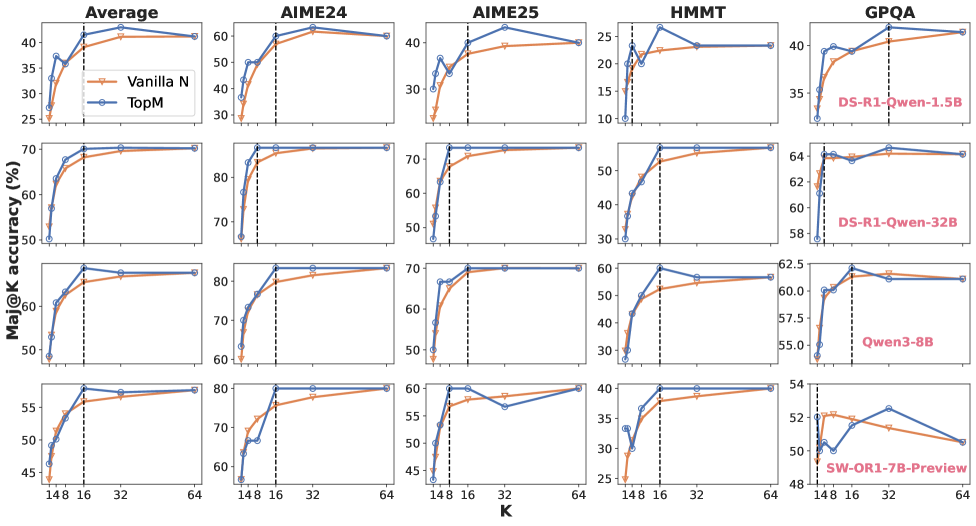
The image displays a set of line graphs comparing the performance of two methods, **Vanilla N** (orange) and **TopM** (blue), across five datasets: **Average**, **AIME24**, **AIME25**, **HMMT**, and **GPQA**. Each subplot shows how Mean@K accuracy (%) evolves as the parameter **K** varies. Vertical dashed lines at **K=32** are present in all subplots, likely indicating a threshold or reference point. Annotations in some subplots highlight specific model configurations (e.g., "DS-R1-Qwen-1.5B", "Qwen3-8B").
---
### Components/Axes
- **X-axis (K)**: Labeled with values **148, 16, 32, 64** (non-linear scale, possibly categorical or segmented).
- **Y-axis (Mean@K Accuracy %)**: Ranges from **25% to 80%**.
- **Legend**:
- **Vanilla N** (orange line)
- **TopM** (blue line)
- **Subplots**:
- **Average** (top-left)
- **AIME24** (top-middle)
- **AIME25** (top-right)
- **HMMT** (middle-left)
- **GPQA** (middle-right)
---
### Detailed Analysis
#### **Average Subplot**
- **Vanilla N**: Starts at ~30% (K=148), rises to ~40% (K=16), ~50% (K=32), and ~60% (K=64).
- **TopM**: Starts at ~35% (K=148), peaks at ~45% (K=16), ~55% (K=32), and ~65% (K=64).
- **Vertical Line (K=32)**: Both lines cross ~50% (Vanilla N) and ~55% (TopM).
#### **AIME24 Subplot**
- **Vanilla N**: ~30% (K=148) → ~40% (K=16) → ~50% (K=32) → ~60% (K=64).
- **TopM**: ~35% (K=148) → ~45% (K=16) → ~55% (K=32) → ~65% (K=64).
- **Vertical Line (K=32)**: Similar crossing points as Average.
#### **AIME25 Subplot**
- **Vanilla N**: ~30% (K=148) → ~40% (K=16) → ~50% (K=32) → ~60% (K=64).
- **TopM**: ~35% (K=148) → ~45% (K=16) → ~55% (K=32) → ~65% (K=64).
- **Vertical Line (K=32)**: Consistent with other subplots.
#### **HMMT Subplot**
- **Vanilla N**: ~30% (K=148) → ~40% (K=16) → ~50% (K=32) → ~60% (K=64).
- **TopM**: ~35% (K=148) → ~45% (K=16) → ~55% (K=32) → ~65% (K=64).
- **Annotations**:
- **DS-R1-Qwen-32B**: 64% (K=64)
- **Qwen3-8B**: 58.5% (K=64)
#### **GPQA Subplot**
- **Vanilla N**: ~30% (K=148) → ~40% (K=16) → ~50% (K=32) → ~60% (K=64).
- **TopM**: ~35% (K=148) → ~45% (K=16) → ~55% (K=32) → ~65% (K=64).
- **Annotations**:
- **DS-R1-Qwen-1.5B**: 62.5% (K=64)
- **Qwen3-8B**: 55.0% (K=64)
- **SW-OR1-7B-Preview**: 54% (K=64)
---
### Key Observations
1. **Consistent Performance**: **TopM** consistently outperforms **Vanilla N** across all datasets and K values.
2. **Threshold at K=32**: The vertical dashed lines at K=32 may indicate a critical point where performance stabilizes or a reference for evaluation.
3. **Model-Specific Annotations**:
- In **HMMT**, **DS-R1-Qwen-32B** achieves 64% accuracy at K=64, while **Qwen3-8B** scores 58.5%.
- In **GPQA**, **DS-R1-Qwen-1.5B** reaches 62.5%, **Qwen3-8B** 55.0%, and **SW-OR1-7B-Preview** 54%.
---
### Interpretation
- **Method Comparison**: **TopM** demonstrates superior scalability and accuracy, suggesting it is more effective for the evaluated tasks.
- **K=32 as a Reference**: The vertical lines may highlight a standard evaluation point, possibly reflecting a balance between computational cost and performance.
- **Model Variants**: The annotations indicate that specific model configurations (e.g., Qwen3-8B, DS-R1-Qwen) have distinct performance profiles, potentially tied to their architecture or training data.
- **Anomalies**: The **SW-OR1-7B-Preview** in GPQA shows a lower accuracy (54%) compared to other models, suggesting it may be less optimized for this dataset.
This analysis underscores the importance of method selection and model configuration in achieving high Mean@K accuracy, with **TopM** emerging as the more robust approach.