## Line Chart: Average Liar Score vs. Layer Index
### Overview
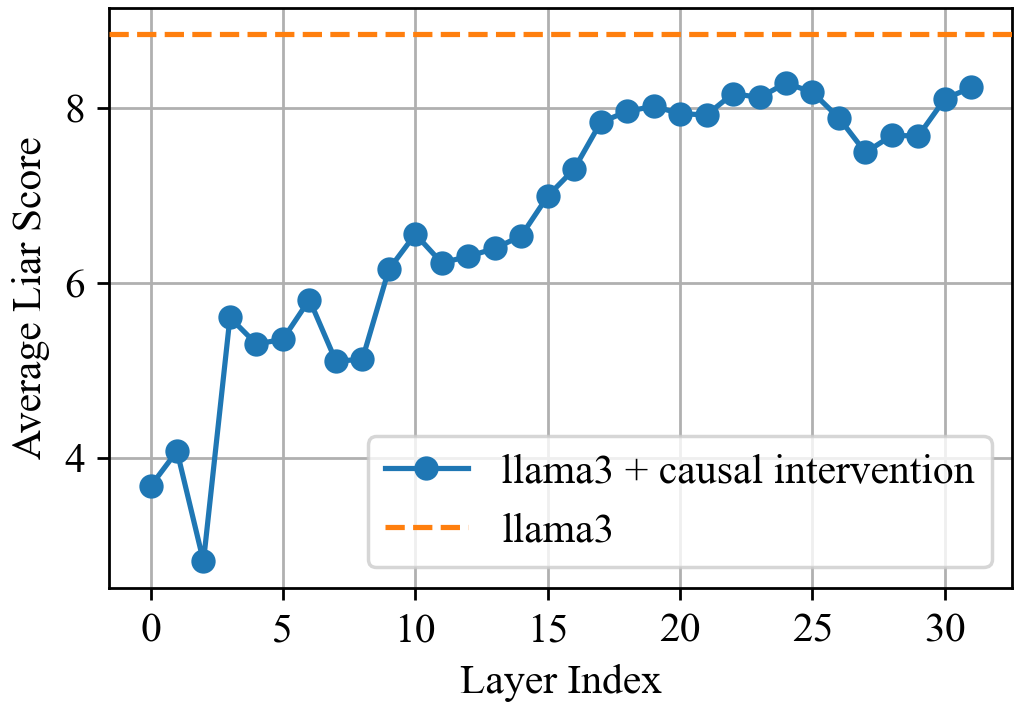
The image is a line chart comparing the "Average Liar Score" across different "Layer Index" values for two scenarios: "llama3 + causal intervention" and "llama3". The chart displays how the liar score changes as the layer index increases.
### Components/Axes
* **X-axis:** Layer Index, ranging from 0 to 30 in increments of 5.
* **Y-axis:** Average Liar Score, ranging from 4 to 8 in increments of 2.
* **Legend (bottom-right):**
* Blue line with circular markers: "llama3 + causal intervention"
* Dashed orange line: "llama3"
### Detailed Analysis
* **llama3 + causal intervention (Blue Line):**
* The line starts at approximately (0, 3.7).
* It drops to approximately (2, 2.8).
* It rises to approximately (4, 5.7).
* It fluctuates between 5 and 6 until layer index 10.
* It increases from approximately (10, 6.5) to approximately (15, 7.2).
* It rises sharply to approximately (16, 7.5).
* It plateaus around 8 from layer index 18 to 24.
* It decreases to approximately (26, 7.5).
* It ends at approximately (32, 8.3).
* **llama3 (Dashed Orange Line):**
* The line is a horizontal dashed line at approximately 9.0.
### Key Observations
* The "llama3 + causal intervention" line shows a significant increase in the Average Liar Score as the Layer Index increases, particularly between Layer Index 10 and 20.
* The "llama3" line remains constant across all Layer Index values.
* The "llama3 + causal intervention" score is consistently lower than the "llama3" score until around Layer Index 32.
### Interpretation
The chart suggests that causal intervention in the llama3 model initially reduces the Average Liar Score compared to the baseline llama3 model. However, as the layer index increases, the liar score for the causally intervened model increases, eventually approaching the baseline llama3 model's score. The constant liar score for the baseline llama3 model indicates a stable level of "lying" across all layers, while the intervention causes a dynamic change in the model's behavior across different layers. The initial drop and subsequent rise in the "llama3 + causal intervention" line could indicate that the intervention is effective in early layers but its effect diminishes or changes in later layers.