# Technical Document Extraction: Average Liar Score Analysis
## 1. Image Overview
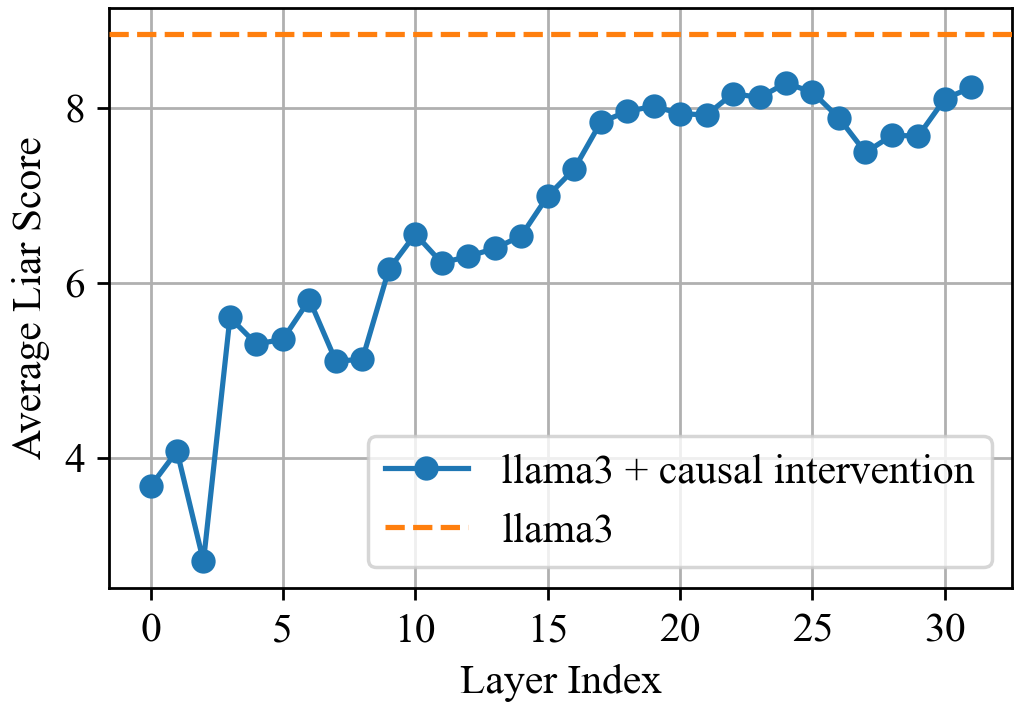
This image is a line graph comparing the performance of two versions of the Llama3 model across different neural network layers. It measures a metric titled "Average Liar Score" against the "Layer Index."
## 2. Component Isolation
### Header / Metadata
* **Language:** English
* **Primary Metric (Y-axis):** Average Liar Score
* **Independent Variable (X-axis):** Layer Index
### Main Chart Area
* **X-axis Scale:** 0 to 30, with major tick marks every 5 units (0, 5, 10, 15, 20, 25, 30).
* **Y-axis Scale:** 4 to 8, with major tick marks every 2 units (4, 6, 8).
* **Grid:** A light gray orthogonal grid is present, aligned with the major tick marks.
### Legend (Spatial Grounding: Bottom-Right [x≈0.65, y≈0.25])
* **Blue line with circular markers:** `llama3 + causal intervention`
* **Orange dashed line:** `llama3`
---
## 3. Data Series Analysis
### Series 1: llama3 (Baseline)
* **Visual Trend:** A horizontal, static dashed line.
* **Description:** This series represents a constant baseline. It remains perfectly flat across all layer indices.
* **Estimated Value:** ~8.8 (positioned consistently above the 8.0 mark).
### Series 2: llama3 + causal intervention
* **Visual Trend:** An upward-sloping, fluctuating line. The score starts low in the early layers, exhibits significant volatility between layers 0-10, and then shows a steadier climb toward the baseline, peaking around layer 25 before a slight dip and recovery.
* **Detailed Data Points (Estimated from Grid):**
* **Layer 0:** ~3.7
* **Layer 2:** ~2.8 (Local minimum)
* **Layer 3:** ~5.6 (Sharp increase)
* **Layer 5:** ~5.4
* **Layer 10:** ~6.6
* **Layer 15:** ~7.0
* **Layer 20:** ~7.9
* **Layer 25:** ~8.3 (Peak performance)
* **Layer 27:** ~7.5 (Local dip)
* **Layer 31:** ~8.2
---
## 4. Key Trends and Observations
1. **Intervention Impact:** The "causal intervention" significantly lowers the Average Liar Score in the earlier layers of the model compared to the standard Llama3 baseline.
2. **Convergence:** As the Layer Index increases (moving toward the output layers of the model), the score for the intervened model trends upward, gradually approaching the baseline value of the standard Llama3.
3. **Early Layer Volatility:** There is a notable "V" shape in the first three layers, where the score drops sharply at Layer 2 before rebounding at Layer 3.
4. **Late Stage Stability:** Between layers 15 and 25, the model shows a relatively consistent improvement before stabilizing near the baseline value in the final layers (30+).
## 5. Data Table Reconstruction (Extracted Values)
| Layer Index | llama3 (Baseline) | llama3 + causal intervention (Approx.) |
| :--- | :--- | :--- |
| 0 | ~8.8 | 3.7 |
| 5 | ~8.8 | 5.4 |
| 10 | ~8.8 | 6.6 |
| 15 | ~8.8 | 7.0 |
| 20 | ~8.8 | 7.9 |
| 25 | ~8.8 | 8.3 |
| 30 | ~8.8 | 8.1 |