\n
## Line Chart: Average Liar Score vs. Layer Index
### Overview
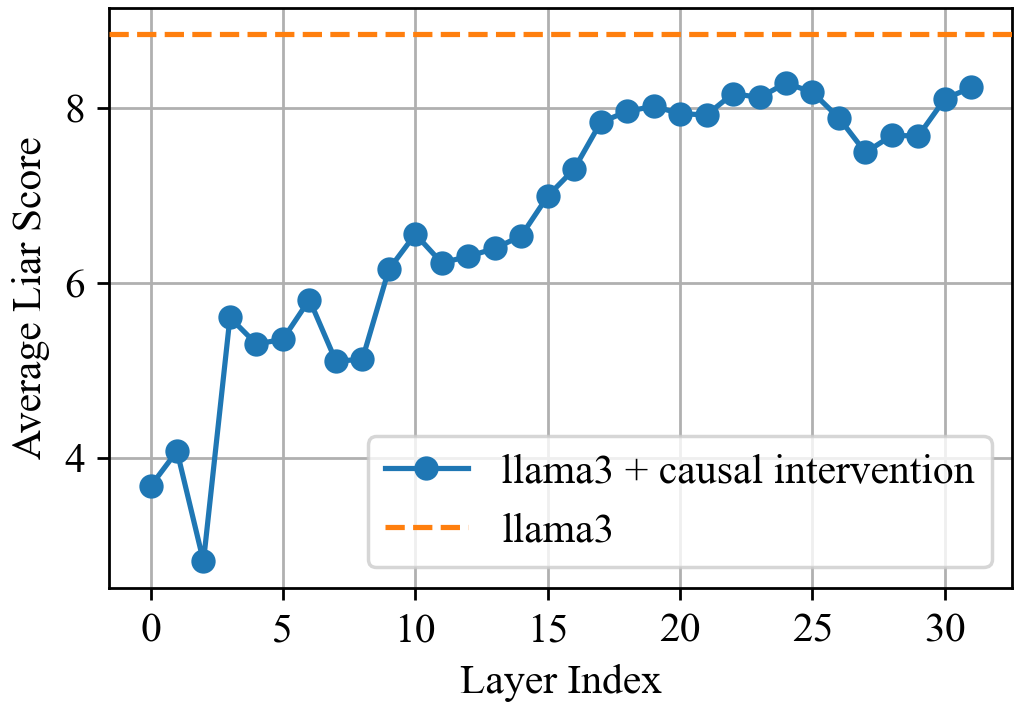
This line chart compares the "Average Liar Score" of "llama3 + causal intervention" against "llama3" across different "Layer Index" values, ranging from 0 to approximately 30. The chart visually demonstrates how the liar score changes with increasing layer index for both models.
### Components/Axes
* **X-axis:** "Layer Index" - ranging from 0 to 30, with tick marks at integer values.
* **Y-axis:** "Average Liar Score" - ranging from approximately 2 to 9, with tick marks at integer values.
* **Data Series 1:** "llama3 + causal intervention" - represented by a solid blue line with circular markers.
* **Data Series 2:** "llama3" - represented by a dashed orange line.
* **Legend:** Located in the bottom-right corner of the chart, clearly labeling each data series with its corresponding color.
### Detailed Analysis
**llama3 + causal intervention (Blue Line):**
The blue line starts at approximately 3.7 at Layer Index 0. It then sharply decreases to a minimum of approximately 2.5 at Layer Index 2. From Layer Index 2 to approximately Layer Index 10, the line exhibits a generally upward trend, fluctuating between approximately 5.5 and 6.5. Between Layer Index 10 and Layer Index 20, the line continues to increase, reaching a plateau around 8.0. From Layer Index 20 to Layer Index 30, the line fluctuates slightly around 8.0, with a final value of approximately 8.2 at Layer Index 30.
* Layer Index 0: ~3.7
* Layer Index 2: ~2.5
* Layer Index 5: ~5.5
* Layer Index 8: ~6.2
* Layer Index 10: ~6.5
* Layer Index 15: ~7.8
* Layer Index 20: ~8.0
* Layer Index 25: ~8.1
* Layer Index 30: ~8.2
**llama3 (Orange Dashed Line):**
The orange dashed line is a horizontal line at approximately 8.5, remaining constant across all Layer Index values.
### Key Observations
* The "llama3 + causal intervention" model initially exhibits a lower liar score than the baseline "llama3" model, but quickly surpasses it.
* The "llama3 + causal intervention" model's liar score increases significantly with increasing layer index, eventually plateauing around a value of 8.0.
* The "llama3" model maintains a constant liar score throughout all layers.
* The causal intervention appears to initially reduce the liar score, but then leads to a substantial increase as the layer index grows.
### Interpretation
The data suggests that the causal intervention applied to the "llama3" model initially reduces its tendency to "lie" (as measured by the liar score). However, as the model progresses through deeper layers (higher layer index), the liar score increases and eventually approaches a similar level to the baseline "llama3" model. The constant liar score of the baseline "llama3" model indicates that its behavior is not significantly affected by layer depth.
The plateauing of the "llama3 + causal intervention" model's liar score suggests that the effect of the causal intervention diminishes at higher layers. This could be due to the intervention being overridden by other factors within the model, or it could indicate that the intervention is only effective up to a certain depth. The initial decrease in liar score could be a result of the intervention correcting some initial biases or flaws in the model. The subsequent increase could be due to the model learning to exploit the intervention or developing new biases at deeper layers.
The difference between the two models highlights the potential benefits and limitations of causal interventions in large language models. While interventions can initially improve model behavior, they may not be sufficient to prevent the emergence of undesirable traits at higher layers. Further research is needed to understand how to design interventions that are robust and effective across all layers of a model.