## Diagram: 10x10 Binary Grid Pattern
### Overview
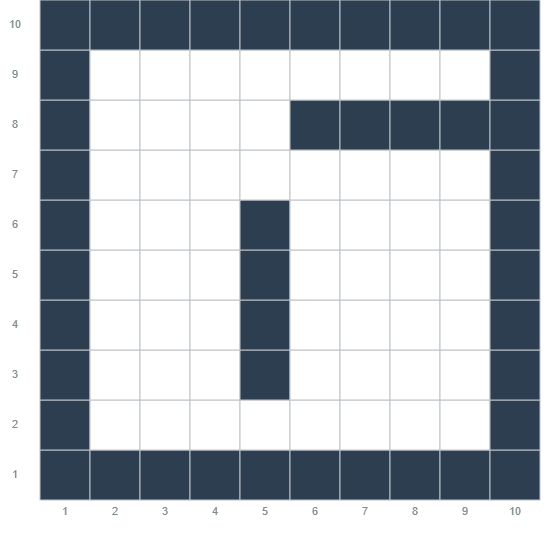
The image displays a 10x10 grid with a binary (filled/unfilled) cell pattern. The grid is bounded by a coordinate system with both the horizontal (x) and vertical (y) axes numbered from 1 to 10. The filled cells (dark gray/black) form a specific, non-random pattern against the white background cells. The overall visual resembles a stylized letter "A" or a similar glyph.
### Components/Axes
* **Grid Structure:** A 10x10 square grid.
* **Axes:**
* **X-axis (Bottom):** Labeled with numbers 1 through 10, increasing from left to right.
* **Y-axis (Left):** Labeled with numbers 1 through 10, increasing from bottom to top.
* **Cell States:** Two states are present:
* **Filled (Dark):** A dark gray/black color.
* **Unfilled (White):** The default background color of the grid cells.
* **Legend:** No explicit legend is present. The meaning of the filled vs. unfilled cells is not defined within the image.
### Detailed Analysis
The pattern is constructed as follows (described from the bottom row, y=1, upwards):
* **Row 1 (y=1):** All cells (x=1 to x=10) are **filled**.
* **Row 2 (y=2):** Only the border cells are filled: (x=1) and (x=10). Cells x=2 through x=9 are **unfilled**.
* **Row 3 (y=3):** Border cells (x=1, x=10) and the center cell (x=5) are **filled**. All others are unfilled.
* **Row 4 (y=4):** Identical to Row 3: (x=1, x=5, x=10) **filled**.
* **Row 5 (y=5):** Identical to Row 3: (x=1, x=5, x=10) **filled**.
* **Row 6 (y=6):** Identical to Row 3: (x=1, x=5, x=10) **filled**.
* **Row 7 (y=7):** Only the border cells are filled: (x=1) and (x=10). Cells x=2 through x=9 are **unfilled**.
* **Row 8 (y=8):** Border cells (x=1, x=10) and a horizontal bar from x=5 to x=9 are **filled**. Specifically, cells (x=1, x=5, x=6, x=7, x=8, x=9, x=10) are filled. Cells x=2, x=3, x=4 are unfilled.
* **Row 9 (y=9):** Only the border cells are filled: (x=1) and (x=10). Cells x=2 through x=9 are **unfilled**.
* **Row 10 (y=10):** All cells (x=1 to x=10) are **filled**.
**Spatial Summary:** The filled cells create a complete outer border (rows 1 & 10, columns 1 & 10). Inside this border, a vertical line runs up the center at column 5 from row 3 to row 6. A horizontal line connects this vertical stem to the right border at row 8, spanning columns 5 through 9.
### Key Observations
1. **Symmetry:** The pattern is symmetric about the vertical axis running through column 5.5 (the center line between columns 5 and 6).
2. **Enclosed Spaces:** The pattern creates two distinct white (unfilled) rectangular regions:
* A large rectangle on the left, bounded by x=2-4 and y=2-9.
* A smaller rectangle on the right, bounded by x=6-9 and y=2-7.
3. **Connectivity:** All filled cells are connected orthogonally (up, down, left, right), forming a single continuous shape.
4. **Data Density:** The grid is sparsely filled. Out of 100 total cells, 38 are filled and 62 are unfilled.
### Interpretation
This image is a **visual pattern representation**, not a data chart. It conveys information through spatial arrangement rather than numerical values.
* **What it demonstrates:** The grid encodes a specific 2D binary pattern. This could represent:
* **Pixel Art:** A low-resolution icon or character (strongly resembling a capital "A").
* **A Binary Matrix:** A simple form of data storage or a test pattern for grid-based systems.
* **A Game Board State:** A possible configuration in a grid-based game or puzzle.
* **A Stencil or Mask:** A pattern for cutting or blocking material.
* **Relationships:** The elements relate through geometric adjacency and containment. The border defines the field, and the internal lines define sub-regions and create the recognizable glyph.
* **Notable Features:** The most salient feature is the intentional, non-random pattern that forms a universally recognizable symbol. The perfect symmetry and clean lines suggest it was digitally generated for a specific illustrative or functional purpose. The lack of a title or legend means its exact context must be inferred from its use in a larger document.