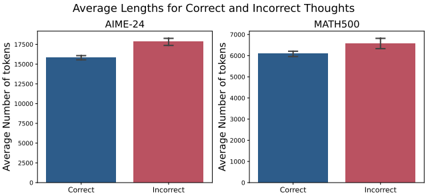
## Bar Charts: Average Lengths for Correct and Incorrect Thoughts
### Overview
The image contains two bar charts comparing the average lengths (in number of tokens) of "correct" and "incorrect" thoughts for two different datasets: AIME-24 and MATH500. Each chart displays two bars, one for "correct" thoughts and one for "incorrect" thoughts, with error bars indicating variability.
### Components/Axes
**Overall Title:** Average Lengths for Correct and Incorrect Thoughts
**Left Chart (AIME-24):**
* **Title:** AIME-24
* **Y-axis Label:** Average Number of tokens
* **Y-axis Scale:** 0 to 17500, with increments of 2500 (0, 2500, 5000, 7500, 10000, 12500, 15000, 17500)
* **X-axis Labels:** Correct, Incorrect
* **Bar Colors:** Correct (Dark Blue), Incorrect (Red)
**Right Chart (MATH500):**
* **Title:** MATH500
* **Y-axis Label:** Average Number of tokens
* **Y-axis Scale:** 0 to 7000, with increments of 1000 (0, 1000, 2000, 3000, 4000, 5000, 6000, 7000)
* **X-axis Labels:** Correct, Incorrect
* **Bar Colors:** Correct (Dark Blue), Incorrect (Red)
### Detailed Analysis
**AIME-24 Chart:**
* **Correct Thoughts:** The dark blue bar reaches approximately 15800 tokens.
* **Incorrect Thoughts:** The red bar reaches approximately 17800 tokens.
* **Error Bars:** Error bars are present on both bars, indicating the standard error or confidence interval.
**MATH500 Chart:**
* **Correct Thoughts:** The dark blue bar reaches approximately 6100 tokens.
* **Incorrect Thoughts:** The red bar reaches approximately 6600 tokens.
* **Error Bars:** Error bars are present on both bars, indicating the standard error or confidence interval.
### Key Observations
* In both datasets (AIME-24 and MATH500), the average length of "incorrect" thoughts is greater than the average length of "correct" thoughts.
* The difference in average length between "correct" and "incorrect" thoughts appears more pronounced in the AIME-24 dataset compared to the MATH500 dataset.
* The scale of the Y-axis differs significantly between the two charts, reflecting the different magnitudes of token counts in the two datasets.
### Interpretation
The data suggests that, on average, "incorrect" thoughts tend to be longer (in terms of the number of tokens) than "correct" thoughts in both the AIME-24 and MATH500 datasets. This could indicate that incorrect solutions or reasoning processes require more elaboration or involve more steps than correct ones. The larger difference in token counts for AIME-24 might suggest that the nature of "incorrectness" in that dataset is more verbose or complex compared to MATH500. The error bars provide an indication of the variability within each category, which should be considered when interpreting the significance of the observed differences.