\n
## Bar Chart: Average Lengths for Correct and Incorrect Thoughts
### Overview
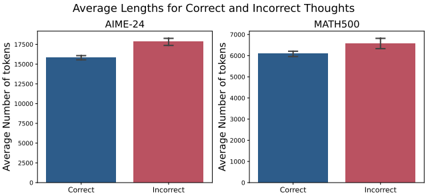
The image presents a bar chart comparing the average number of tokens for correct and incorrect "thoughts" across two datasets: AIME-24 and MATH500. Each dataset is represented by a pair of bars, one for correct thoughts and one for incorrect thoughts. Error bars are included on top of each bar, indicating the standard error or confidence interval.
### Components/Axes
* **Title:** "Average Lengths for Correct and Incorrect Thoughts" (centered at the top)
* **X-axis Label:** "Correct" and "Incorrect" (appears under each set of bars)
* **Y-axis Label:** "Average Number of tokens" (appears on the left side of each chart)
* **Datasets:** AIME-24 (left chart), MATH500 (right chart)
* **Bar Colors:** Blue for "Correct" thoughts, Red for "Incorrect" thoughts.
* **Error Bars:** Black vertical lines indicating variability.
### Detailed Analysis
**AIME-24 Dataset (Left Chart):**
* **Correct Thoughts:** The blue bar representing correct thoughts has a height of approximately 14,800 tokens. The error bar extends from roughly 14,300 to 15,300 tokens.
* **Incorrect Thoughts:** The red bar representing incorrect thoughts has a height of approximately 16,200 tokens. The error bar extends from roughly 15,700 to 16,700 tokens.
* **Trend:** The bar for incorrect thoughts is visibly taller than the bar for correct thoughts, indicating a higher average token count for incorrect thoughts.
**MATH500 Dataset (Right Chart):**
* **Correct Thoughts:** The blue bar representing correct thoughts has a height of approximately 6,300 tokens. The error bar extends from roughly 6,000 to 6,600 tokens.
* **Incorrect Thoughts:** The red bar representing incorrect thoughts has a height of approximately 6,800 tokens. The error bar extends from roughly 6,400 to 7,200 tokens.
* **Trend:** Similar to the AIME-24 dataset, the bar for incorrect thoughts is taller than the bar for correct thoughts, suggesting a higher average token count for incorrect thoughts.
### Key Observations
* In both datasets, incorrect thoughts have a higher average number of tokens than correct thoughts.
* The difference in average token count between correct and incorrect thoughts appears more pronounced in the AIME-24 dataset than in the MATH500 dataset.
* The error bars suggest that the differences observed are statistically significant, but further statistical testing would be needed to confirm this.
### Interpretation
The data suggests that, on average, incorrect "thoughts" (likely referring to reasoning steps or generated text) are longer than correct ones in both the AIME-24 and MATH500 datasets. This could indicate that incorrect reasoning often involves more verbose or convoluted explanations, or that the models explore more possibilities before arriving at an incorrect conclusion. The larger difference in AIME-24 might suggest that the complexity of the problems in that dataset leads to more significant differences in the length of reasoning for correct versus incorrect answers. The length of the "thought" process may be a useful indicator of the likelihood of correctness, though it is not a perfect predictor. It is important to note that "thoughts" are likely generated by a language model, and the token count is a measure of the generated text's length, not necessarily the complexity of the underlying reasoning.