# Technical Data Extraction: Heatmap Analysis
## 1. Document Overview
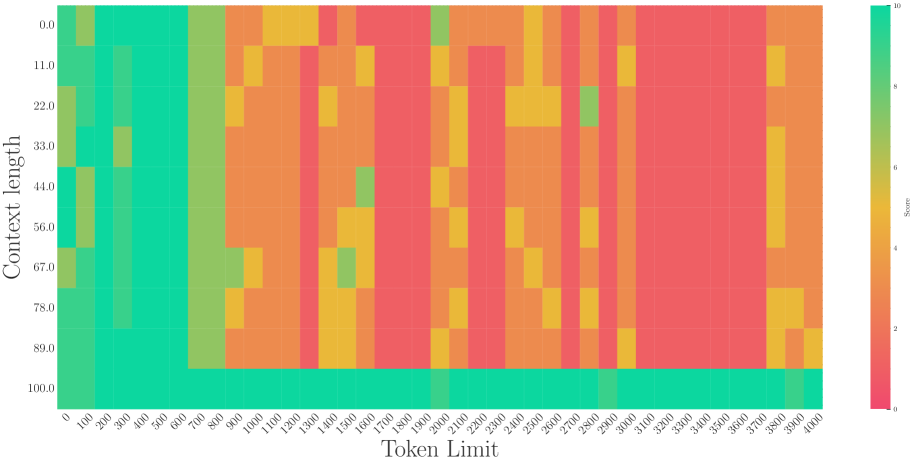
This image is a technical heatmap visualization representing the relationship between "Token Limit" and "Context length" relative to a "Score" metric. The chart uses a color gradient to represent numerical values across a two-dimensional grid.
## 2. Component Isolation
### A. Header/Axes Labels
- **Y-Axis Label (Left):** "Context length"
- **X-Axis Label (Bottom):** "Token Limit"
- **Legend Label (Right):** "Score"
### B. Main Chart Area (Data Grid)
The chart consists of a grid where the X-axis represents discrete token intervals and the Y-axis represents context length percentages.
### C. Legend (Color Scale)
- **Location:** Right side of the image.
- **Scale Range:** 0 to 10.
- **Color Mapping:**
- **Teal/Bright Green (Value 10):** High performance/score.
- **Yellow/Light Green (Value 5-7):** Moderate performance/score.
- **Orange/Red (Value 0-3):** Low performance/score.
---
## 3. Axis Markers and Categories
### X-Axis: Token Limit
The axis contains 41 discrete markers ranging from 0 to 4000 in increments of 100:
`0, 100, 200, 300, 400, 500, 600, 700, 800, 900, 1000, 1100, 1200, 1300, 1400, 1500, 1600, 1700, 1800, 1900, 2000, 2100, 2200, 2300, 2400, 2500, 2600, 2700, 2800, 2900, 3000, 3100, 3200, 3300, 3400, 3500, 3600, 3700, 3800, 3900, 4000`
### Y-Axis: Context length
The axis contains 10 markers representing percentages or relative lengths:
`0.0, 11.0, 22.0, 33.0, 44.0, 56.0, 67.0, 78.0, 89.0, 100.0`
---
## 4. Trend Verification and Data Extraction
### General Trends
1. **High Performance Zone (Left):** There is a consistent block of high scores (Teal, ~10) for Token Limits between 0 and 600 across almost all context lengths.
2. **Performance Degradation (Middle-Right):** As the Token Limit increases beyond 900, the scores generally drop into the low range (Red/Orange, ~0-3), with sporadic "islands" of moderate performance.
3. **The "100.0" Context Length Exception:** The bottom-most row (Context length 100.0) maintains a high score (Teal, ~10) across almost the entire Token Limit range, regardless of the horizontal value.
4. **Vertical Strips:** There are vertical bands of consistent color, suggesting that for certain Token Limits (e.g., 1300, 1700-1900, 3100-3700), the score is consistently low regardless of context length (excluding the 100.0 row).
### Specific Data Point Observations (Logic-Check)
* **Token Limit 0-600:** Predominantly Teal (Score 9-10).
* **Token Limit 700-800:** Transition zone, predominantly Light Green (Score 7-8).
* **Token Limit 1300:** Vertical strip of Red (Score ~1-2).
* **Token Limit 2000:** Shows a vertical strip of Yellow/Green (Score ~6-7) amidst a lower-scoring region.
* **Token Limit 3800:** Shows a vertical strip of Yellow (Score ~5-6).
* **Token Limit 4000:** The final column shows a slight improvement to Orange/Yellow compared to the deep Red of the 3100-3700 range.
---
## 5. Reconstructed Data Table (Summary)
| Context Length | Token Limit 0-600 | Token Limit 900-1200 | Token Limit 1300 | Token Limit 3100-3700 | Token Limit 4000 |
| :--- | :--- | :--- | :--- | :--- | :--- |
| **0.0 - 89.0** | High (9-10) | Low-Mid (3-5) | Very Low (1-2) | Very Low (1-2) | Low-Mid (3-5) |
| **100.0** | High (10) | High (10) | High (10) | High (10) | High (10) |
---
## 6. Final Technical Summary
The heatmap illustrates a "short-context" or "low-token" bias where performance is optimal at Token Limits below 700. A significant anomaly exists at the maximum Context Length (100.0), where performance remains high across the entire tested Token Limit spectrum. Conversely, the region between Token Limits 3100 and 3700 represents the lowest performance area for all context lengths except the maximum.