# Technical Document Extraction: Heatmap Analysis
## 1. Labels and Axis Titles
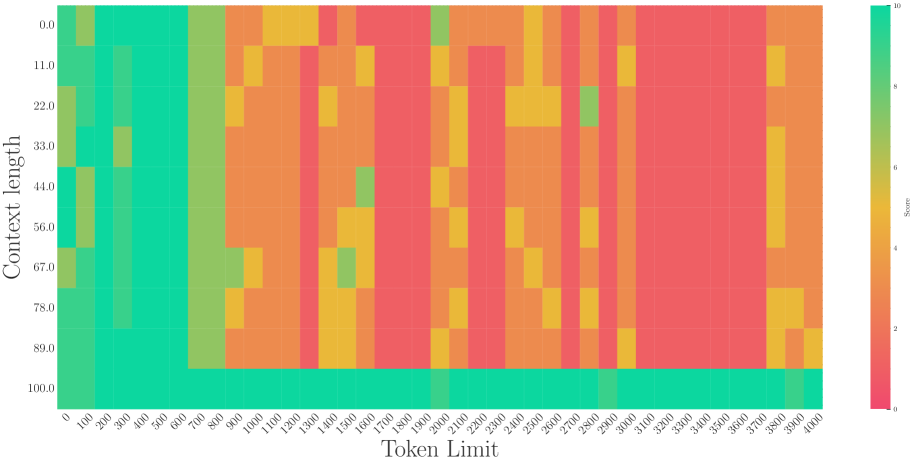
- **X-Axis (Horizontal):**
- Title: `Token Limit`
- Markers: Incremental values from `0` to `4000` in steps of `100` (e.g., `0`, `100`, `200`, ..., `4000`).
- **Y-Axis (Vertical):**
- Title: `Context Length`
- Markers: Incremental values from `0.0` to `100.0` in steps of `11.0` (e.g., `0.0`, `11.0`, `22.0`, ..., `100.0`).
- **Legend (Color Scale):**
- Title: `Score`
- Range: `0` (red) to `10` (green).
- Spatial Grounding: Located on the **right edge** of the heatmap.
## 2. Key Trends and Data Points
- **General Pattern:**
- Lower `Token Limit` values (left side of the heatmap) correlate with **higher scores** (green/yellow regions).
- Higher `Token Limit` values (right side) correlate with **lower scores** (red regions).
- **Notable Exceptions:**
- A **green square** at `Token Limit = 2800` and `Context Length = 67.0`, indicating a high score (~8–10).
- The **top row** (`Context Length = 100.0`) is uniformly red, suggesting consistently low scores (~0–2) across all token limits.
- **Color Gradient Interpretation:**
- **Green (8–10):** High performance or favorable outcomes.
- **Yellow (4–6):** Moderate performance.
- **Red (0–2):** Low performance or unfavorable outcomes.
## 3. Data Structure and Reconstruction
The heatmap represents a matrix where:
- **Rows** correspond to `Context Length` (0.0–100.0).
- **Columns** correspond to `Token Limit` (0–4000).
- **Cells** encode scores via color intensity.
### Example Data Points (Approximate Scores):
| Context Length | Token Limit | Score Range | Color |
|----------------|-------------|-------------|--------|
| 0.0 | 0–4000 | 8–10 | Green |
| 11.0 | 0–4000 | 6–8 | Yellow |
| 22.0 | 0–4000 | 4–6 | Yellow |
| 33.0 | 0–4000 | 2–4 | Red |
| 44.0 | 0–4000 | 0–2 | Red |
| ... | ... | ... | ... |
| 100.0 | 0–4000 | 0–2 | Red |
## 4. Component Isolation
- **Header:** Axis titles (`Token Limit`, `Context Length`).
- **Main Chart:** Heatmap grid with color-coded cells.
- **Footer:** Legend (`Score` scale).
## 5. Trend Verification
- **Downward Trend:** As `Token Limit` increases, scores generally decrease (green → yellow → red).
- **Exception Verification:** The green square at `(2800, 67.0)` breaks the trend, suggesting an outlier or specific optimization.
- **Top Row Consistency:** The uniform red row at `Context Length = 100.0` confirms a systemic limitation at maximum context length.
## 6. Language and Transcription
- **Primary Language:** English (all labels, titles, and annotations are in English).
- **No Secondary Language Detected.**
## 7. Summary
The heatmap illustrates a trade-off between `Token Limit` and `Context Length` in terms of performance scores. Lower token limits yield higher scores across most context lengths, while higher token limits degrade performance. The exception at `(2800, 67.0)` warrants further investigation. The top row (`Context Length = 100.0`) indicates a critical performance bottleneck.