## Multiple Line Charts: Network Analysis Metrics vs. Iteration
### Overview
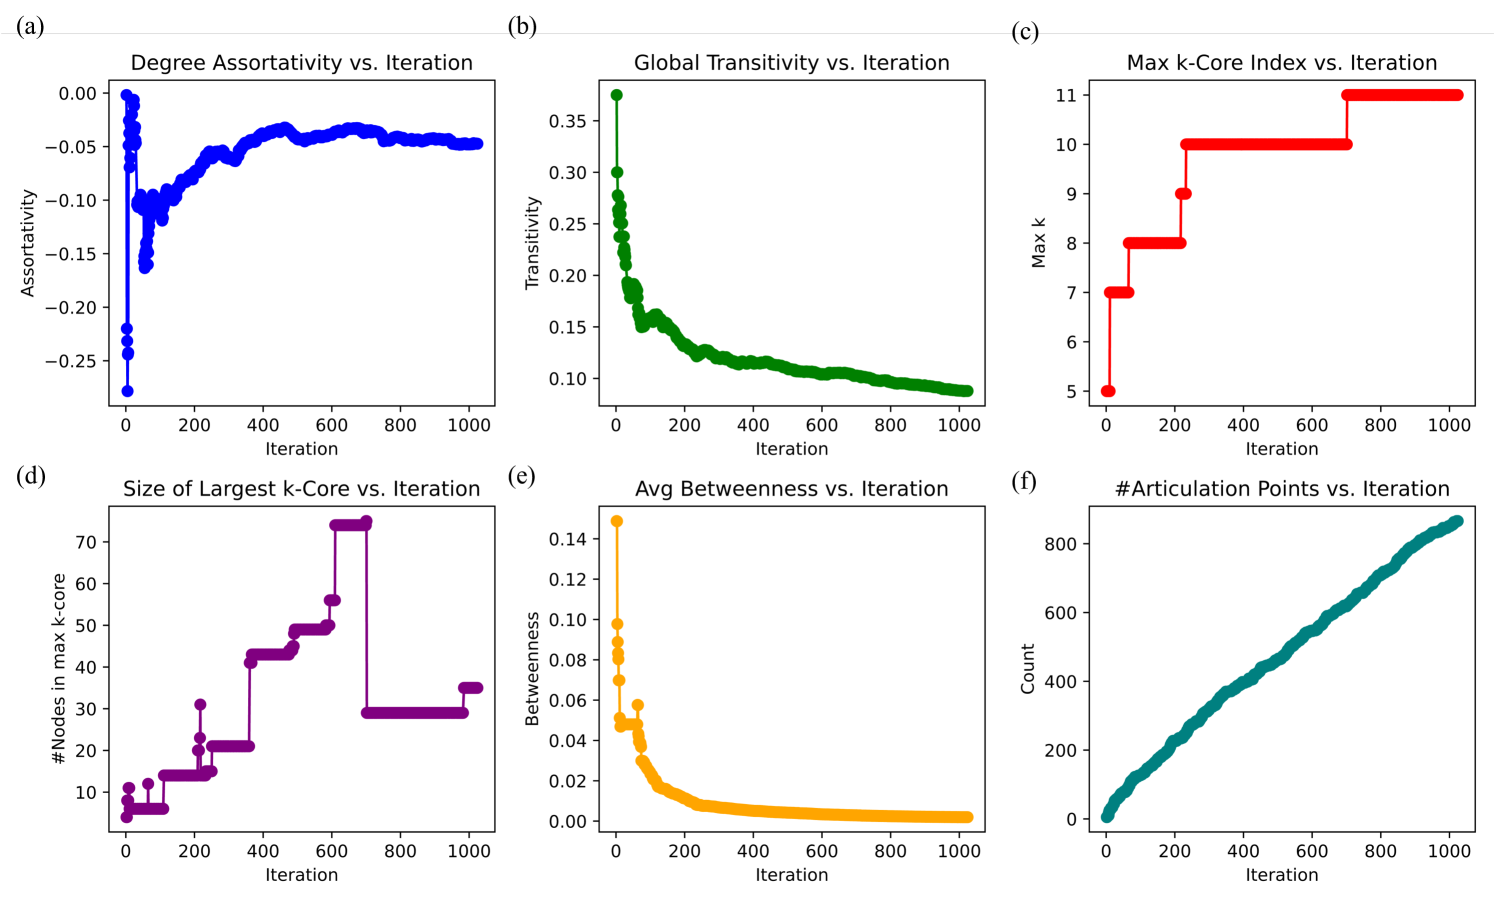
The image presents six line charts arranged in a 2x3 grid, each displaying a different network analysis metric's evolution over iterations. The metrics include Degree Assortativity, Global Transitivity, Max k-Core Index, Size of Largest k-Core, Average Betweenness, and the Number of Articulation Points. All charts share a common x-axis representing "Iteration," ranging from 0 to 1000.
### Components/Axes
* **General:**
* X-axis (all charts): "Iteration," ranging from 0 to 1000.
* **(a) Degree Assortativity vs. Iteration:**
* Y-axis: "Assortativity," ranging from -0.25 to 0.00.
* Data Series: Blue line representing Degree Assortativity.
* **(b) Global Transitivity vs. Iteration:**
* Y-axis: "Transitivity," ranging from 0.10 to 0.35.
* Data Series: Green line representing Global Transitivity.
* **(c) Max k-Core Index vs. Iteration:**
* Y-axis: "Max k," ranging from 5 to 11.
* Data Series: Red line representing Max k-Core Index.
* **(d) Size of Largest k-Core vs. Iteration:**
* Y-axis: "#Nodes in max k-core," ranging from 0 to 70.
* Data Series: Purple line representing the Size of Largest k-Core.
* **(e) Avg Betweenness vs. Iteration:**
* Y-axis: "Betweenness," ranging from 0.00 to 0.14.
* Data Series: Orange line representing Average Betweenness.
* **(f) #Articulation Points vs. Iteration:**
* Y-axis: "Count," ranging from 0 to 800.
* Data Series: Teal line representing the Number of Articulation Points.
### Detailed Analysis
* **(a) Degree Assortativity vs. Iteration:**
* Trend: The blue line starts at approximately -0.25 at iteration 0, rapidly increases to around -0.05 by iteration 100, and then gradually increases to stabilize around -0.04 for iterations 400-1000.
* Data Points:
* Iteration 0: Assortativity ≈ -0.25
* Iteration 100: Assortativity ≈ -0.05
* Iteration 400-1000: Assortativity ≈ -0.04
* **(b) Global Transitivity vs. Iteration:**
* Trend: The green line starts at approximately 0.37 at iteration 0, rapidly decreases to around 0.15 by iteration 200, and then gradually decreases to stabilize around 0.09 for iterations 600-1000.
* Data Points:
* Iteration 0: Transitivity ≈ 0.37
* Iteration 200: Transitivity ≈ 0.15
* Iteration 600-1000: Transitivity ≈ 0.09
* **(c) Max k-Core Index vs. Iteration:**
* Trend: The red line shows a step-wise increase. It starts at 5, jumps to 7 around iteration 50, then to 8 around iteration 150, then to 9 around iteration 250, then to 10 around iteration 350, and finally to 11 around iteration 750, where it remains stable.
* Data Points:
* Iteration 0-50: Max k = 5
* Iteration 50-150: Max k = 7
* Iteration 150-250: Max k = 8
* Iteration 250-350: Max k = 9
* Iteration 350-750: Max k = 10
* Iteration 750-1000: Max k = 11
* **(d) Size of Largest k-Core vs. Iteration:**
* Trend: The purple line shows a step-wise increase, similar to the Max k-Core Index. It starts around 5, jumps to 10 around iteration 50, then to 15 around iteration 100, then to 20 around iteration 150, then to 30 around iteration 200, then to 43 around iteration 350, then to 45 around iteration 400, then to 50 around iteration 550, then to 72 around iteration 650, and finally drops to 30 around iteration 750, where it remains stable.
* Data Points:
* Iteration 0-50: #Nodes ≈ 5
* Iteration 50-100: #Nodes ≈ 10
* Iteration 100-150: #Nodes ≈ 15
* Iteration 150-200: #Nodes ≈ 20
* Iteration 200-350: #Nodes ≈ 30
* Iteration 350-400: #Nodes ≈ 43
* Iteration 400-550: #Nodes ≈ 45
* Iteration 550-650: #Nodes ≈ 50
* Iteration 650-750: #Nodes ≈ 72
* Iteration 750-1000: #Nodes ≈ 30
* **(e) Avg Betweenness vs. Iteration:**
* Trend: The orange line starts at approximately 0.14 at iteration 0, rapidly decreases to around 0.01 by iteration 200, and then gradually decreases to stabilize around 0.003 for iterations 600-1000.
* Data Points:
* Iteration 0: Betweenness ≈ 0.14
* Iteration 200: Betweenness ≈ 0.01
* Iteration 600-1000: Betweenness ≈ 0.003
* **(f) #Articulation Points vs. Iteration:**
* Trend: The teal line shows a nearly linear increase from approximately 0 at iteration 0 to approximately 850 at iteration 1000.
* Data Points:
* Iteration 0: Count ≈ 0
* Iteration 1000: Count ≈ 850
### Key Observations
* **Convergence:** Several metrics (Degree Assortativity, Global Transitivity, Avg Betweenness) show a trend of converging to a stable value after an initial period of rapid change.
* **Step-wise Changes:** The Max k-Core Index and Size of Largest k-Core exhibit step-wise increases, suggesting discrete phases of network evolution.
* **Linear Growth:** The Number of Articulation Points increases almost linearly with the number of iterations.
### Interpretation
The charts illustrate how various network properties evolve over iterations, likely during a network growth or optimization process. The convergence of metrics like Assortativity, Transitivity, and Betweenness suggests that the network reaches a relatively stable state after a certain number of iterations. The step-wise changes in k-Core related metrics indicate that the network's core structure is evolving in discrete stages. The linear increase in articulation points suggests a continuous addition of critical nodes that connect different parts of the network. These observations provide insights into the dynamics and structural changes occurring within the network as it evolves.