## Charts: Network Metrics vs. Iteration
### Overview
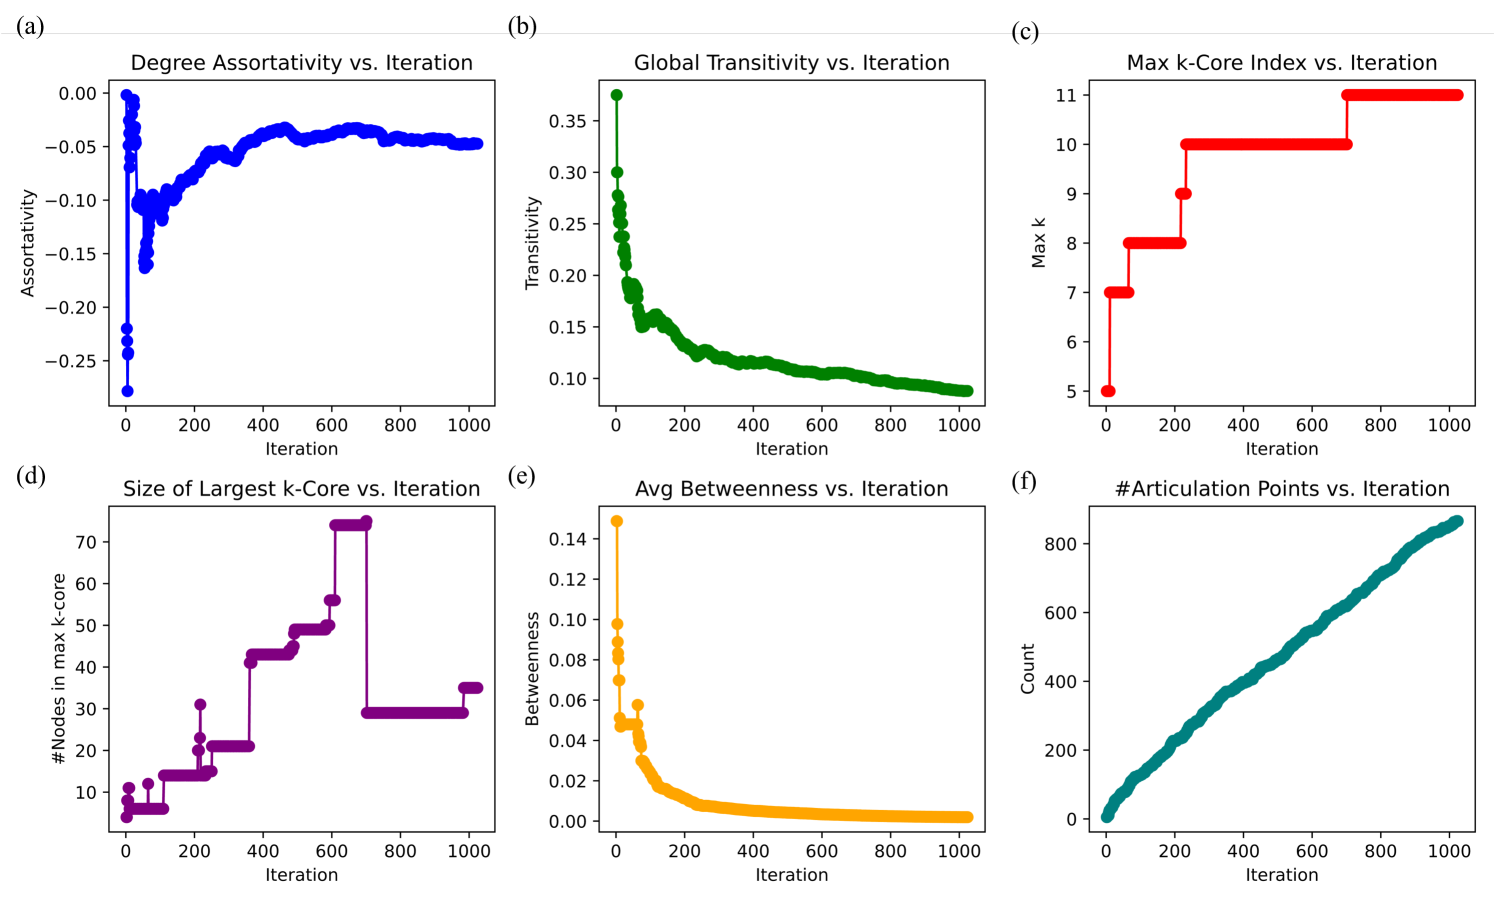
This image displays a grid of six sub-plots, labeled (a) through (f), illustrating the evolution of various network topology metrics over 1,000 iterations. Each plot tracks a specific metric on the Y-axis against the common X-axis of "Iteration." The data suggests a simulation or optimization process where network structure is being modified or grown over time.
### Components/Axes
All six plots share a common X-axis labeled **"Iteration"** ranging from 0 to 1000.
| Sub-plot | Metric | Y-axis Label | Range |
| :--- | :--- | :--- | :--- |
| (a) | Degree Assortativity | Assortativity | -0.25 to 0.00 |
| (b) | Global Transitivity | Transitivity | 0.10 to 0.35 |
| (c) | Max k-Core Index | Max k | 5 to 11 |
| (d) | Size of Largest k-Core | #Nodes in max k-core | 0 to 70 |
| (e) | Avg Betweenness | Betweenness | 0.00 to 0.14 |
| (f) | #Articulation Points | Count | 0 to 800 |
---
### Detailed Analysis
#### (a) Degree Assortativity (Top-Left)
* **Trend:** The line starts with high volatility in the first 100 iterations, then trends upward, eventually stabilizing.
* **Values:** Starts at approximately -0.26. It fluctuates sharply between -0.26 and 0.00 before iteration 100. After iteration 200, the trend is a gradual, smooth increase, plateauing around -0.05 from iteration 600 to 1000.
#### (b) Global Transitivity (Top-Center)
* **Trend:** Exponential-like decay.
* **Values:** Starts at a peak of ~0.38. It drops rapidly within the first 200 iterations to ~0.15. From iteration 200 to 1000, the decline slows significantly, ending at approximately 0.09.
#### (c) Max k-Core Index (Top-Right)
* **Trend:** A monotonic step function.
* **Values:** Starts at 5. It increases in discrete steps: to 7 (very early), 8 (at ~100), 9 (at ~220), 10 (at ~230), and finally 11 (at ~700). It remains constant at 11 from iteration 700 to 1000.
#### (d) Size of Largest k-Core (Bottom-Left)
* **Trend:** A step function with significant volatility and a notable structural collapse.
* **Values:** Starts at ~5. It grows in steps, reaching ~75 nodes by iteration 600. At iteration 700, there is a sharp, discontinuous drop in the number of nodes in the largest k-core, falling to ~29. It then recovers slightly to ~35 by iteration 1000.
#### (e) Avg Betweenness (Bottom-Center)
* **Trend:** Rapid exponential decay.
* **Values:** Starts at a peak of ~0.15. It drops precipitously within the first 100 iterations to below 0.02. From iteration 200 to 1000, the value remains very low, hovering near 0.00.
#### (f) #Articulation Points (Bottom-Right)
* **Trend:** Linear, monotonic increase.
* **Values:** Starts at 0. The count increases steadily and consistently throughout the entire 1000 iterations, reaching approximately 850 by the end of the process.
---
### Key Observations
* **Initialization Phase:** The first 200 iterations appear to be a "burn-in" or initialization phase, characterized by high volatility in plots (a), (b), (d), and (e).
* **Structural Divergence:** While the "Max k-Core Index" (c) stabilizes at 11, the "Size of Largest k-Core" (d) experiences a massive drop at iteration 700. This indicates that while the *density* (k-index) of the core remained high, the *number of nodes* participating in that core structure collapsed significantly.
* **Consistent Growth:** The number of articulation points (f) is the only metric that shows a perfectly consistent, linear growth trend, suggesting that the network is continuously adding nodes or edges that increase the number of critical bridges/bottlenecks in the graph.
### Interpretation
The data suggests a network evolution process, likely a graph rewiring or growth algorithm.
* **Early Instability:** The initial volatility suggests the network starts from a random or poorly defined state and rapidly organizes into a more structured form.
* **Efficiency vs. Connectivity:** The drop in "Global Transitivity" (b) and "Avg Betweenness" (e) suggests the network is moving away from a highly clustered, centralized structure toward a more sparse, perhaps more distributed or tree-like structure.
* **The Iteration 700 Event:** The most significant anomaly is the drop in the size of the largest k-core (d) at iteration 700. This coincides with the Max k-Core Index (c) reaching its maximum value of 11. This implies a "phase transition" where the network optimized its core density at the expense of the core's size. The network likely "pruned" or reorganized its core to achieve a higher k-index, resulting in a smaller, tighter core, while simultaneously increasing the number of articulation points (f), indicating a more fragile or "stringy" global topology.