TECHNICAL ASSET FINGERPRINT
6dc0e7bebb5f0eccb0b919f7
Click to view fullscreen
Press ESC or click to close
FOUND IN PAPERS
EXPERT: gemini-3.1-pro-preview VERSION 1
RUNTIME: gemini/gemini-3.1-pro-preview
INTEL_VERIFIED
## Panel of Line Charts: Network Topology Metrics vs. Iteration
### Overview
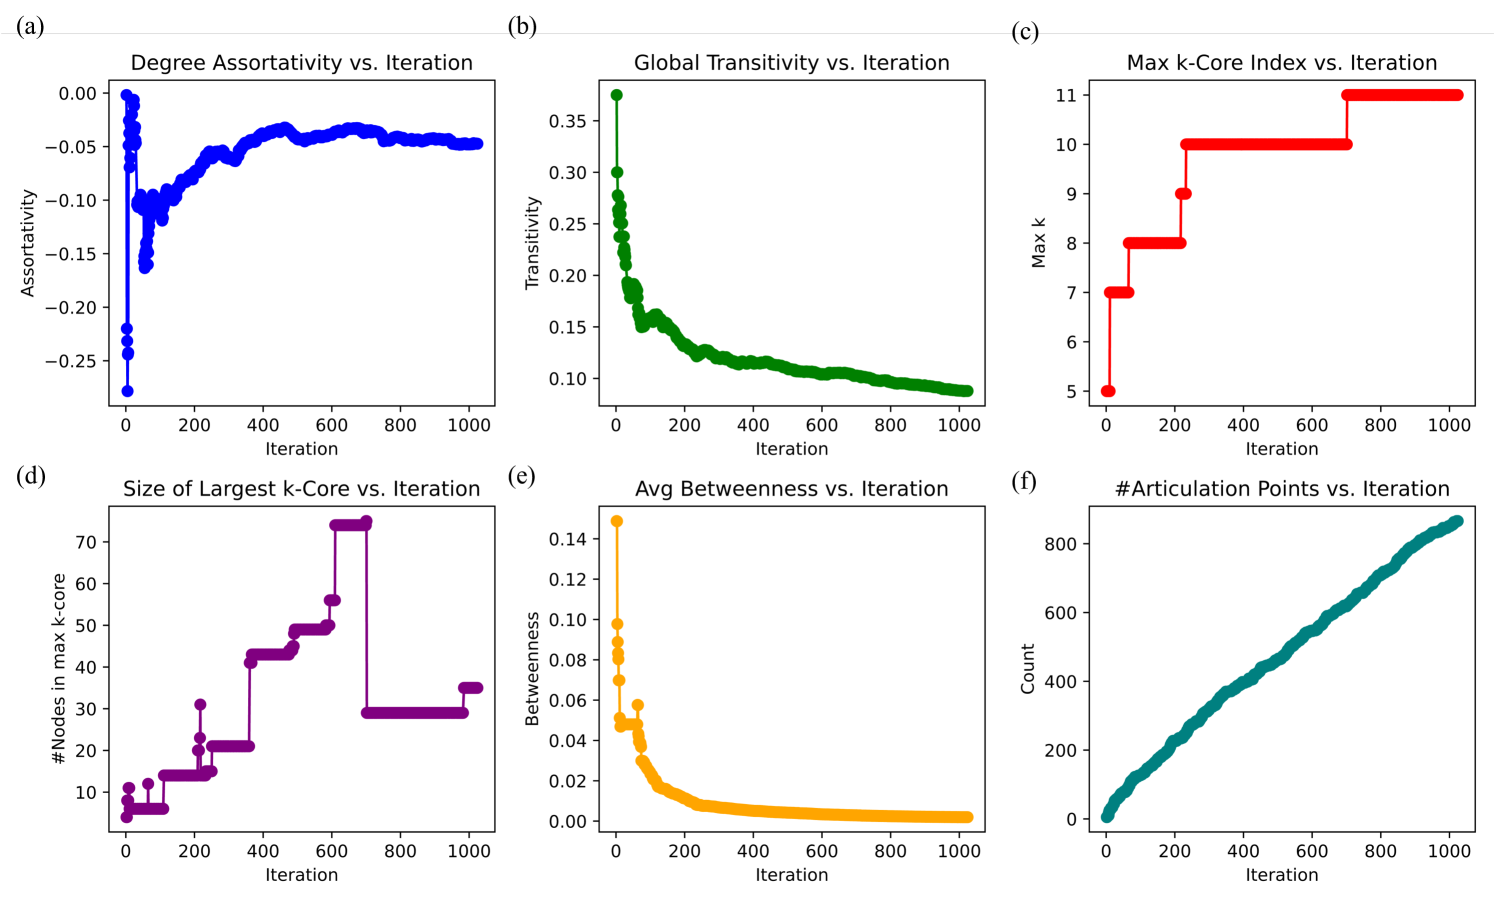
The image consists of a 2x3 grid of six line charts, labeled (a) through (f). Each chart tracks a different network topology metric on the y-axis against a common x-axis representing "Iteration" (from 0 to 1000). The charts illustrate the evolution of a network's structural properties over time or algorithmic steps. There is no explicit legend box; instead, each subplot utilizes a distinct color for its data series. All text is in English.
### Components/Axes
**Common X-Axis (All Plots):**
* **Label:** "Iteration"
* **Scale:** Linear, ranging from 0 to slightly over 1000.
* **Major Ticks:** 0, 200, 400, 600, 800, 1000.
**Specific Y-Axes by Plot:**
* **(a) Top-Left:** "Assortativity" (Scale: 0.00 to -0.25, Ticks: 0.00, -0.05, -0.10, -0.15, -0.20, -0.25)
* **(b) Top-Center:** "Transitivity" (Scale: 0.10 to 0.35, Ticks: 0.10, 0.15, 0.20, 0.25, 0.30, 0.35)
* **(c) Top-Right:** "Max k" (Scale: 5 to 11, Ticks: 5, 6, 7, 8, 9, 10, 11)
* **(d) Bottom-Left:** "#Nodes in max k-core" (Scale: 10 to 70, Ticks: 10, 20, 30, 40, 50, 60, 70)
* **(e) Bottom-Center:** "Betweenness" (Scale: 0.00 to 0.14, Ticks: 0.00, 0.02, 0.04, 0.06, 0.08, 0.10, 0.12, 0.14)
* **(f) Bottom-Right:** "Count" (Scale: 0 to 800, Ticks: 0, 200, 400, 600, 800)
---
### Detailed Analysis
#### (a) Degree Assortativity vs. Iteration
* **Spatial Grounding:** Top-left quadrant.
* **Visual Trend:** The blue line with circular markers exhibits extreme early volatility, dropping sharply, rebounding, and then gradually smoothing out into a slight upward curve that plateaus.
* **Data Points:**
* Starts at iteration 0 near **0.00**.
* Plummets rapidly within the first ~20 iterations to a minimum of approximately **-0.28**.
* Rebounds quickly to roughly **-0.10** by iteration 50.
* Experiences a secondary dip to **-0.16** around iteration 60.
* Gradually climbs and stabilizes. By iteration 400, it reaches roughly **-0.04** and remains relatively flat, ending near **-0.05** at iteration 1000.
#### (b) Global Transitivity vs. Iteration
* **Spatial Grounding:** Top-center.
* **Visual Trend:** The green line with circular markers shows a rapid exponential-style decay, starting high and flattening out near the bottom of the y-axis.
* **Data Points:**
* Starts at a peak of approximately **0.37** at iteration 0.
* Drops precipitously in the first 100 iterations to roughly **0.16**.
* Continues a slower, steady decline, crossing **0.10** around iteration 700.
* Ends at approximately **0.09** at iteration 1000.
#### (c) Max k-Core Index vs. Iteration
* **Spatial Grounding:** Top-right quadrant.
* **Visual Trend:** The red line with circular markers forms a monotonically increasing step function. It never decreases.
* **Data Points:**
* Starts at a value of **5** at iteration 0.
* Jumps immediately to **7** within the first few iterations.
* Steps up to **8** at approximately iteration 60.
* Steps up to **9** at approximately iteration 220, and almost immediately steps up to **10** around iteration 230.
* Remains flat at **10** for a long duration.
* Steps up to **11** at approximately iteration 700 and remains there until iteration 1000.
#### (d) Size of Largest k-Core vs. Iteration
* **Spatial Grounding:** Bottom-left quadrant.
* **Visual Trend:** The purple line with circular markers is a highly volatile step function. It generally increases but features a massive, sudden drop late in the process.
* **Data Points:**
* Starts low, fluctuating between **~5 and ~12** in the first 100 iterations.
* Steps up to **~15** (iteration 100), then **~21** (iteration 250).
* Jumps significantly to **~43** at iteration 350.
* Steps up to **~50** at iteration 500, then peaks at **~75** at iteration 600.
* *Notable Anomaly:* At approximately iteration 700, the value crashes drastically from **~75** down to **~29**.
* Remains at **~29** until stepping up slightly to **~35** at iteration 980.
#### (e) Avg Betweenness vs. Iteration
* **Spatial Grounding:** Bottom-center.
* **Visual Trend:** The orange/yellow line with circular markers displays a sharp initial drop followed by a smooth, asymptotic tail approaching zero.
* **Data Points:**
* Starts at a peak of approximately **0.145** at iteration 0.
* Crashes rapidly to roughly **0.05** by iteration 20.
* Shows a brief, minor spike to **~0.06** around iteration 60.
* Decays smoothly thereafter, dropping below **0.02** by iteration 200.
* Ends very close to **0.00** (approx. 0.002) at iteration 1000.
#### (f) #Articulation Points vs. Iteration
* **Spatial Grounding:** Bottom-right quadrant.
* **Visual Trend:** The teal/dark cyan line with circular markers shows a nearly perfect, constant linear increase from the origin to the top right.
* **Data Points:**
* Starts at **0** at iteration 0.
* Passes through **~200** at iteration 200, **~400** at iteration 450, and **~600** at iteration 650.
* Ends at a maximum of approximately **850** at iteration 1000.
---
### Key Observations
1. **Direct Correlation in k-Core Metrics:** There is a critical, simultaneous event at approximately **iteration 700**. In plot (c), the Max k-Core Index steps up from 10 to 11. At that exact same iteration in plot (d), the size of that largest k-core drops precipitously from ~75 nodes to ~29 nodes.
2. **Linear Growth vs. Exponential Decay:** The number of articulation points (f) grows linearly, while global transitivity (b) and average betweenness (e) decay in an exponential/asymptotic manner.
3. **Early Volatility:** The first 100 iterations represent a period of rapid structural change, evidenced by the sharp drops in assortativity (a), transitivity (b), and betweenness (e).
---
### Interpretation
These charts collectively describe the evolution of a network graph undergoing a specific algorithmic process—most likely a **network growth model** (adding nodes/edges) or a specific **rewiring process**.
* **The k-Core Phenomenon:** The relationship between charts (c) and (d) is the most revealing. A k-core is a maximal subgraph where all nodes have at least degree *k*. As the network evolves, the maximum *k* value increases (c), meaning the core is becoming denser. However, at iteration 700, when the network achieves an 11-core, the *size* of that core (d) shrinks drastically. This indicates that out of the ~75 nodes that made up the 10-core, only a tightly-knit subset of ~29 nodes gained enough connections to form the new 11-core. The remaining nodes were left behind in the 10-core shell.
* **Network Sparsification/Branching:** The linear increase in Articulation Points (f) (nodes that, if removed, disconnect the graph) strongly suggests that as the network evolves, it is growing many "branches" or tree-like structures.
* **Efficiency and Clustering:** The rapid drop in Average Betweenness (e) suggests that paths between nodes are becoming shorter or more redundant, which lowers the bottleneck effect of individual nodes. Simultaneously, the drop in Global Transitivity (b) indicates that the overall proportion of closed triangles is decreasing.
* **Conclusion:** Reading between the lines, this data likely represents a generative network model where a dense, highly connected core is slowly forming (increasing max k-core), while simultaneously, a large number of peripheral nodes are being added in a tree-like, non-clustered manner (increasing articulation points, decreasing overall transitivity and betweenness).
DECODING INTELLIGENCE...