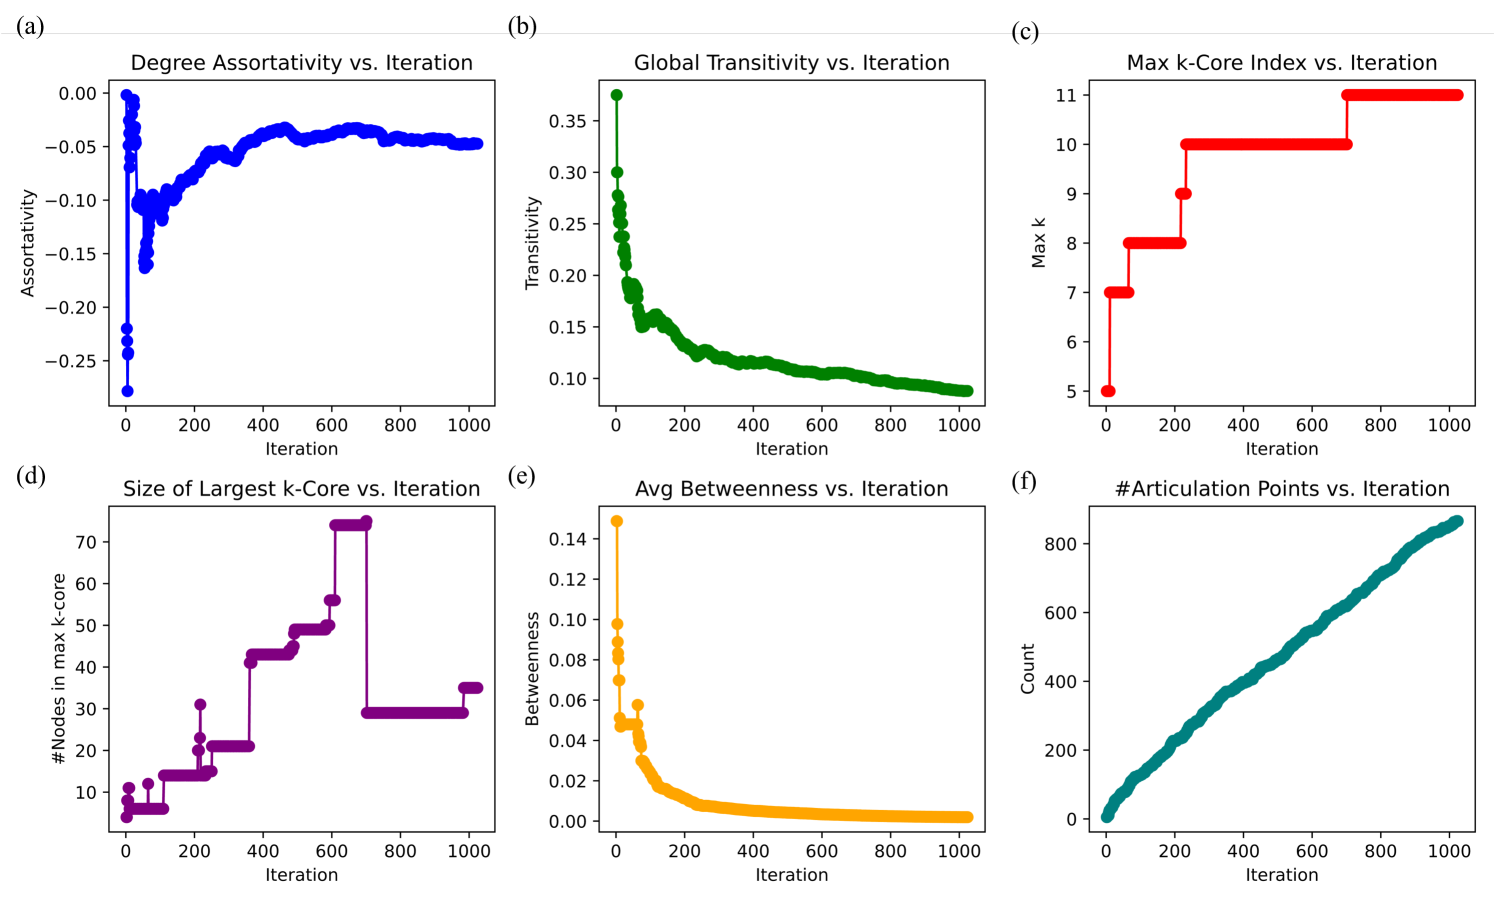
## Charts: Network Metric Evolution vs. Iteration
### Overview
The image presents six separate line charts, each depicting the evolution of a different network metric as a function of iteration. The metrics include Degree Assortativity, Global Transitivity, Max k-Core Index, Size of Largest k-Core, Average Betweenness Centrality, and the number of Articulation Points. All charts share a common x-axis representing "Iteration" ranging from 0 to 1000.
### Components/Axes
Each chart has the following components:
* **X-axis:** "Iteration" (0 to 1000)
* **Y-axis:** Varies depending on the chart, representing the specific network metric.
* **Line:** Represents the metric's value at each iteration.
* **Chart Titles:** Each chart has a title indicating the metric being plotted.
* **Labels:** Each axis is clearly labeled with the metric name.
Specifically:
* **(a) Degree Assortativity vs. Iteration:** Y-axis: "Assortativity" (approximately -0.25 to 0.05)
* **(b) Global Transitivity vs. Iteration:** Y-axis: "Transitivity" (approximately 0.05 to 0.35)
* **(c) Max k-Core Index vs. Iteration:** Y-axis: "Max k" (approximately 4 to 12)
* **(d) Size of Largest k-Core vs. Iteration:** Y-axis: "# Nodes in max k-core" (approximately 0 to 70)
* **(e) Avg Betweenness vs. Iteration:** Y-axis: "Betweenness" (approximately 0.00 to 0.14)
* **(f) #Articulation Points vs. Iteration:** Y-axis: "Count" (approximately 0 to 800)
### Detailed Analysis or Content Details
**(a) Degree Assortativity vs. Iteration:**
The line (blue) initially decreases sharply from iteration 0 to approximately 200, reaching a minimum of around -0.23. It then plateaus and fluctuates between approximately -0.18 and -0.05 for the remainder of the iterations.
**(b) Global Transitivity vs. Iteration:**
The line (green) exhibits a strong decreasing trend. It starts at approximately 0.32 at iteration 0 and steadily declines to around 0.08 by iteration 1000. The decline is most rapid in the first 400 iterations.
**(c) Max k-Core Index vs. Iteration:**
The line (red) shows a relatively stable value around 5 for the first 200 iterations. It then increases rapidly to approximately 11 by iteration 600, and remains relatively constant for the remaining iterations.
**(d) Size of Largest k-Core vs. Iteration:**
The line (purple) with error bars shows significant fluctuations. It starts at approximately 15 at iteration 0, decreases to a minimum of around 2 at iteration 200, then increases dramatically to a maximum of approximately 65 at iteration 800, and finally decreases slightly to around 60 at iteration 1000. The error bars indicate substantial variance in the size of the largest k-core at each iteration.
**(e) Avg Betweenness vs. Iteration:**
The line (orange) shows a generally increasing trend. It starts at approximately 0.02 at iteration 0 and increases steadily to around 0.12 by iteration 1000. The increase is relatively linear throughout the iterations.
**(f) #Articulation Points vs. Iteration:**
The line (teal) exhibits a strong increasing trend. It starts at approximately 50 at iteration 0 and increases almost linearly to around 750 by iteration 1000.
### Key Observations
* **Transitivity Decline:** Global Transitivity consistently decreases, suggesting a loss of network clustering as iterations progress.
* **k-Core Growth:** The Max k-Core Index and Size of Largest k-Core both increase, indicating the emergence of denser, more cohesive subgraphs.
* **Assortativity Stabilization:** Degree Assortativity stabilizes after an initial decline, suggesting a consistent tendency for nodes to connect with others of similar degree.
* **Betweenness Increase:** Average Betweenness Centrality increases, indicating that nodes are becoming more important in connecting different parts of the network.
* **Articulation Point Growth:** The number of Articulation Points increases, suggesting the network is becoming more vulnerable to disruptions as more nodes become critical for maintaining connectivity.
* **k-Core Variability:** The Size of Largest k-Core has significant error bars, indicating instability in the size of the largest k-core.
### Interpretation
The data suggests a dynamic network evolution process. The initial decline in assortativity and transitivity, coupled with the growth of k-cores, indicates a transition from a relatively homogeneous network structure to one with more distinct, densely connected communities. The increasing betweenness centrality and articulation points suggest that the network is becoming more centralized and potentially more fragile. The fluctuations in the size of the largest k-core suggest that the formation of these communities is not entirely stable and may be subject to ongoing restructuring.
The overall trend points towards a network that is becoming more structured, but also potentially more vulnerable to targeted attacks or failures. The specific implications of these changes would depend on the context of the network being analyzed (e.g., social network, infrastructure network, biological network). The error bars on the k-core size suggest that the network's structure is sensitive to initial conditions or random events.