TECHNICAL ASSET FINGERPRINT
6dc0e7bebb5f0eccb0b919f7
Click to view fullscreen
Press ESC or click to close
FOUND IN PAPERS
EXPERT: healer-alpha-free VERSION 1
RUNTIME: free/openrouter/healer-alpha
INTEL_VERIFIED
\n
## Multi-Panel Network Metric Evolution Chart
### Overview
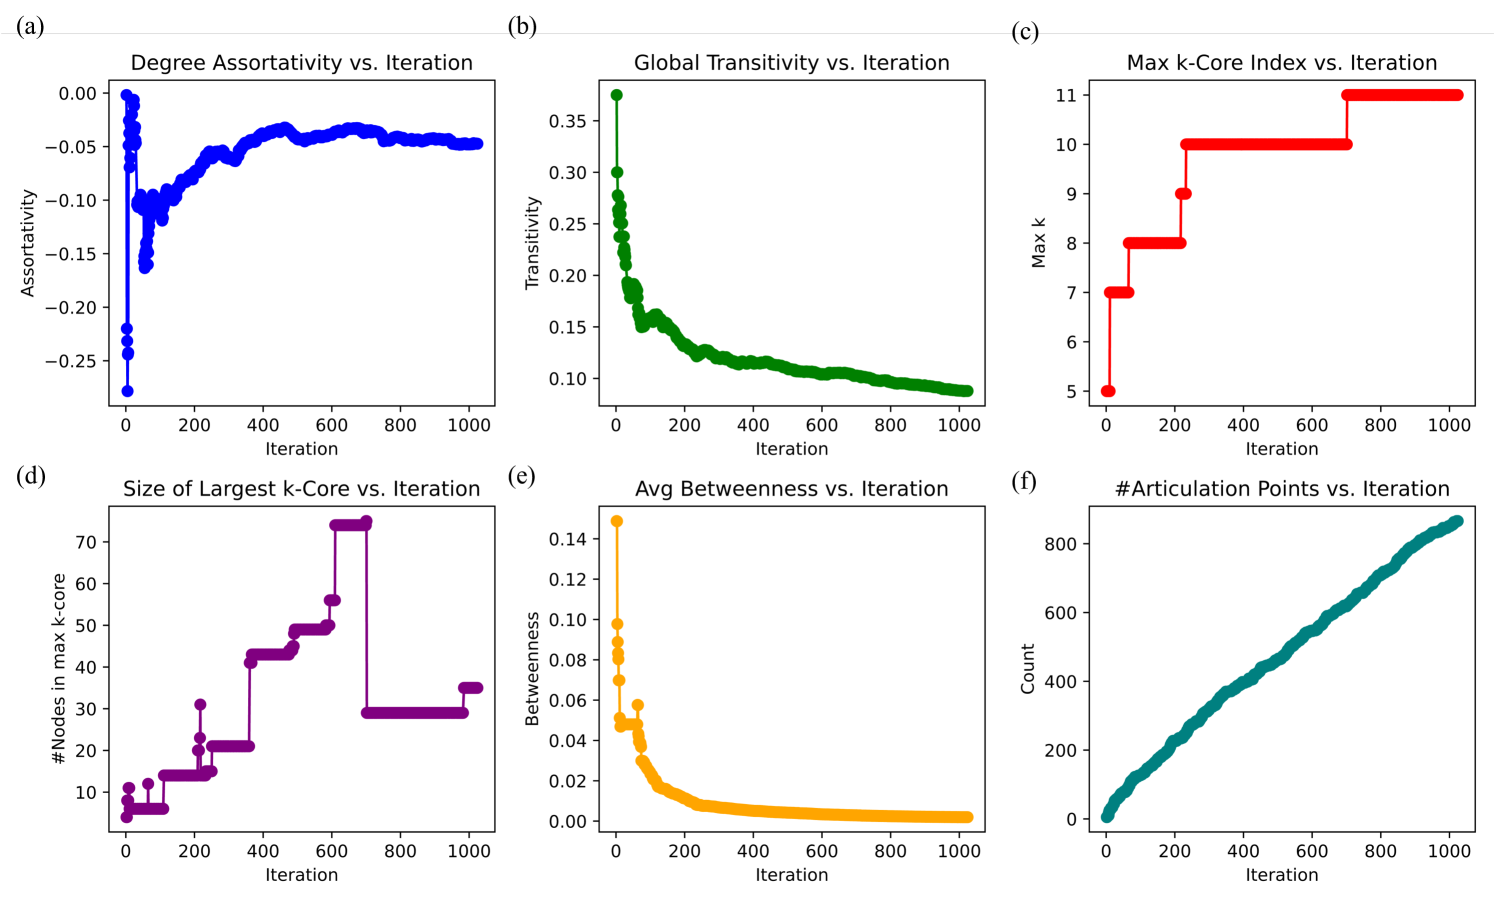
The image is a composite figure containing six distinct line/scatter plots, labeled (a) through (f), arranged in a 2x3 grid. Each plot tracks a different network topology metric over a series of iterations, from iteration 0 to approximately 1000. The plots collectively illustrate the evolution of a network's structural properties during some iterative process.
### Components/Axes
* **Layout:** Six subplots in two rows and three columns.
* **Common X-Axis:** All six plots share the same x-axis label: "Iteration". The scale runs from 0 to 1000, with major tick marks at 0, 200, 400, 600, 800, and 1000.
* **Individual Y-Axes:** Each plot has a unique y-axis label and scale corresponding to its metric.
* **Data Series:** Each plot contains a single data series represented by colored markers connected by lines. The colors are distinct for each plot: blue, green, red, purple, orange, and teal.
* **Titles:** Each subplot has a descriptive title at the top.
### Detailed Analysis
**Panel (a): Degree Assortativity vs. Iteration**
* **Y-Axis:** "Assortativity". Scale from -0.25 to 0.00.
* **Data Series (Blue):** The plot begins with a sharp, volatile drop from near 0.00 to a minimum of approximately -0.27 within the first ~50 iterations. It then recovers sharply to around -0.10, followed by a period of fluctuation with a general upward trend. From iteration ~400 onward, the assortativity stabilizes, oscillating slightly around a value of approximately -0.05.
* **Trend:** Initial sharp negative spike, followed by recovery and stabilization at a slightly negative value.
**Panel (b): Global Transitivity vs. Iteration**
* **Y-Axis:** "Transitivity". Scale from 0.10 to 0.35.
* **Data Series (Green):** The metric starts at its peak of approximately 0.37 at iteration 0. It undergoes a rapid, steep decline until around iteration 100, reaching ~0.15. The rate of decrease slows, forming a convex curve that asymptotically approaches a value just below 0.10 by iteration 1000.
* **Trend:** Monotonic, rapid decay that slows over time, approaching a low asymptote.
**Panel (c): Max k-Core Index vs. Iteration**
* **Y-Axis:** "Max k". Scale from 5 to 11.
* **Data Series (Red):** This is a step plot. The maximum k-core index starts at 5. It increases in discrete steps: to 7 at ~iteration 20, to 8 at ~iteration 80, to 9 at ~iteration 220, to 10 at ~iteration 240, and finally to 11 at ~iteration 700. It remains at 11 until iteration 1000.
* **Trend:** Stepwise, non-decreasing function, indicating the emergence of increasingly dense core structures.
**Panel (d): Size of Largest k-Core vs. Iteration**
* **Y-Axis:** "#Nodes in max k-core". Scale from 10 to 70.
* **Data Series (Purple):** Also a step plot. The size starts around 5 nodes. It increases in steps, with notable jumps at iterations ~200 (to ~22 nodes), ~350 (to ~42 nodes), ~450 (to ~49 nodes), and a large jump at ~600 (to ~75 nodes). After a brief plateau, there is a sharp drop at ~iteration 700 to ~30 nodes, where it stabilizes until iteration 1000.
* **Trend:** General stepwise increase, followed by a significant structural drop/collapse around iteration 700.
**Panel (e): Avg Betweenness vs. Iteration**
* **Y-Axis:** "Betweenness". Scale from 0.00 to 0.14.
* **Data Series (Orange):** The average betweenness centrality starts at its maximum of ~0.15. It plummets dramatically within the first ~50 iterations to below 0.02. The decline continues at a much slower rate, approaching near-zero values (≈0.002) by iteration 1000.
* **Trend:** Extremely rapid initial decay, followed by a long tail approaching zero.
**Panel (f): #Articulation Points vs. Iteration**
* **Y-Axis:** "Count". Scale from 0 to 800.
* **Data Series (Teal):** The number of articulation points (cut vertices) shows a remarkably steady, near-linear increase throughout the entire process. It starts near 0 and rises to approximately 850 by iteration 1000. The line is thick, indicating small, consistent fluctuations around the linear trend.
* **Trend:** Strong, positive linear correlation with iteration.
### Key Observations
1. **Correlated Events:** A major event occurs around iteration 700. The Max k-Core Index (c) reaches its final value of 11, while simultaneously, the Size of the Largest k-Core (d) experiences a dramatic drop from ~75 to ~30 nodes. This suggests a significant reorganization of the network's core.
2. **Divergent Trends:** While transitivity (b) and betweenness (e) decay rapidly and then stabilize at low values, the number of articulation points (f) grows linearly. This indicates a shift from a clustered, locally interconnected structure to a more tree-like, globally fragile structure with many critical nodes.
3. **Stabilization:** Most metrics (a, b, e) show clear stabilization after iteration ~400-600, suggesting the network reaches a quasi-steady state in terms of assortativity, transitivity, and betweenness, even as its core structure (c, d) and vulnerability (f) continue to change.
4. **Initial Volatility:** The first 100-200 iterations are characterized by the most dramatic changes in almost all metrics, indicating a rapid initial transformation phase.
### Interpretation
The data depicts the evolution of a network under an iterative process that fundamentally reshapes its topology. The process appears to:
1. **Degrade Local Clustering:** The sharp drop in transitivity (b) and betweenness (e) indicates the dissolution of triangles and the reduction of nodes acting as bridges, respectively. The network loses its "small-world" properties.
2. **Increase Centralization & Fragility:** The linear rise in articulation points (f) is a key finding. It means the network is becoming increasingly reliant on specific, critical nodes whose removal would disconnect the graph. This, combined with the drop in betweenness, suggests a shift towards a more centralized, hub-and-spoke or tree-like architecture.
3. **Reorganize the Core:** The stepwise increase in the max k-core index (c) shows the emergence of denser and denser core structures. However, the dramatic drop in the size of that core (d) at iteration 700, concurrent with the final step in k-core index, is critical. It implies that while a very dense core (k=11) forms, it does so by shedding many nodes, possibly consolidating into a smaller, tighter, and more exclusive central group. The network's "rich club" becomes both denser and smaller.
4. **Establish Negative Assortativity:** The stabilization of degree assortativity (a) at a negative value (-0.05) indicates a final state where high-degree nodes (hubs) are slightly more likely to connect to low-degree nodes than to other hubs. This is consistent with the emerging centralized, non-clustered structure.
**In summary,** the iterative process transforms the network from a more clustered, interconnected state into a centralized, fragile, and hierarchical structure with a small, dense core and many peripheral nodes dependent on a few critical articulation points. The event at iteration 700 marks a pivotal reorganization where the core consolidates its density at the expense of its size.
DECODING INTELLIGENCE...