## Line Graphs: Network Metrics vs. Iteration
### Overview
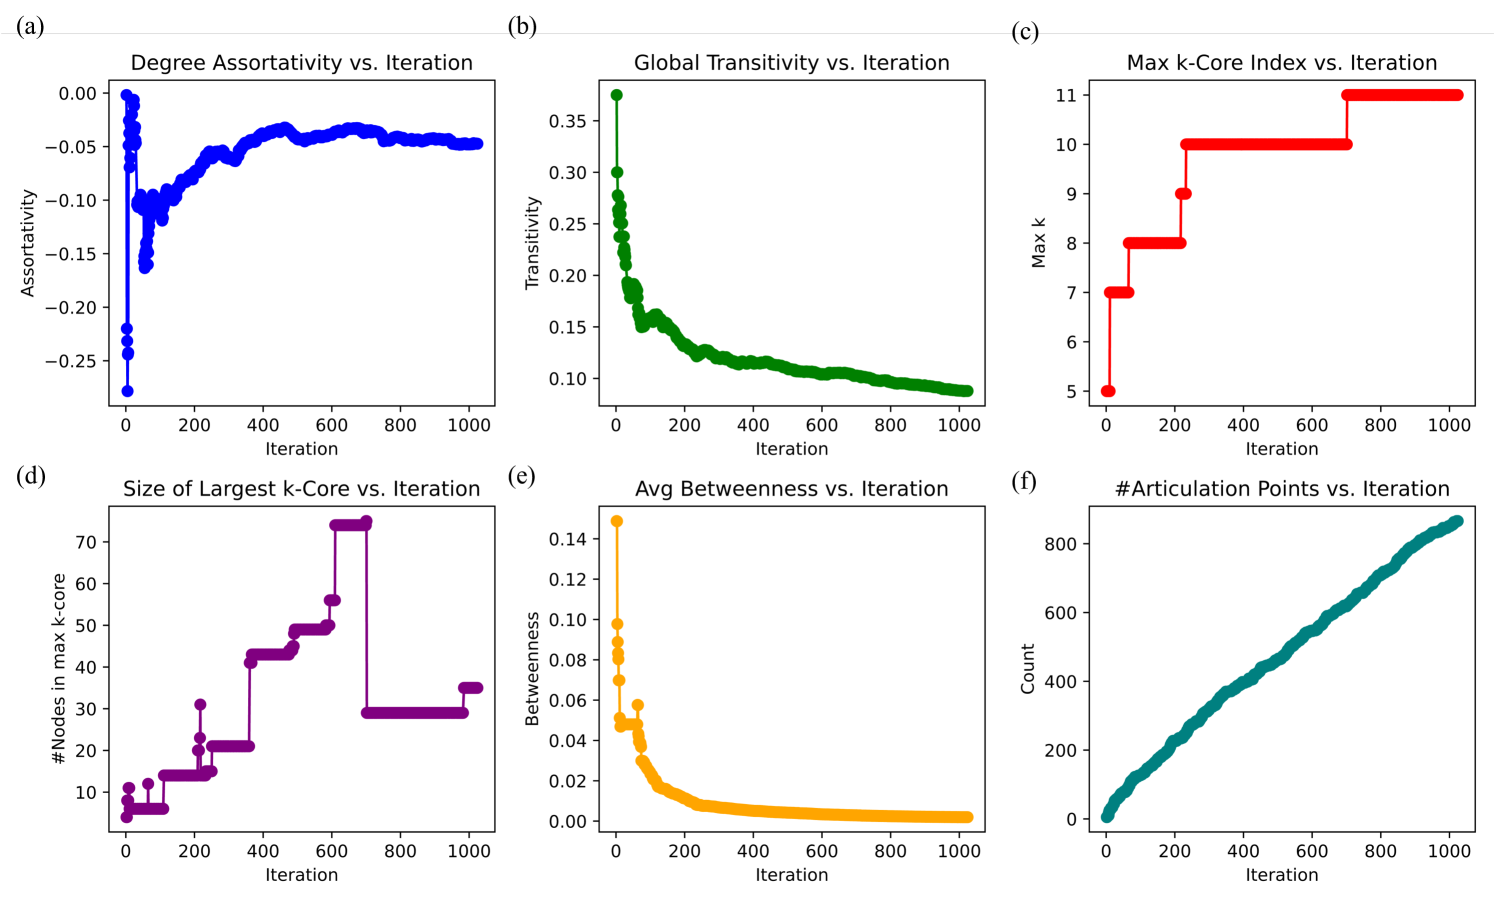
The image contains six subplots (a-f) depicting the evolution of network properties over 1000 iterations. Each subplot tracks a distinct metric: degree assortativity, global transitivity, maximum k-core index, largest k-core size, average betweenness, and articulation points count. All plots show distinct trends, with some metrics stabilizing, others declining sharply, and others increasing linearly or stepwise.
---
### Components/Axes
1. **Subplot (a): Degree Assortativity vs. Iteration**
- **Y-axis**: Assortativity (range: -0.25 to 0.00)
- **X-axis**: Iteration (0 to 1000)
- **Legend**: Blue line
- **Key Features**: Initial sharp increase from -0.25 to -0.15 at iteration 50, followed by stabilization between -0.05 and -0.10.
2. **Subplot (b): Global Transitivity vs. Iteration**
- **Y-axis**: Transitivity (range: 0.10 to 0.35)
- **X-axis**: Iteration (0 to 1000)
- **Legend**: Green line
- **Key Features**: Sharp decline from 0.35 to 0.10 by iteration 300, then gradual plateau.
3. **Subplot (c): Max k-Core Index vs. Iteration**
- **Y-axis**: Max k (range: 5 to 11)
- **X-axis**: Iteration (0 to 1000)
- **Legend**: Red line
- **Key Features**: Stepwise increases: 5→7 at iteration 100, 7→9 at 200, 9→10 at 400, 10→11 at 600, then plateaus.
4. **Subplot (d): Size of Largest k-Core vs. Iteration**
- **Y-axis**: # Nodes in max k-core (range: 0 to 70)
- **X-axis**: Iteration (0 to 1000)
- **Legend**: Purple line
- **Key Features**: Rapid growth to 70 by iteration 600, then abrupt drop to 30 at iteration 800, followed by stabilization.
5. **Subplot (e): Avg Betweenness vs. Iteration**
- **Y-axis**: Betweenness (range: 0 to 0.14)
- **X-axis**: Iteration (0 to 1000)
- **Legend**: Orange line
- **Key Features**: Steep decline from 0.14 to 0.02 by iteration 300, then gradual flattening near 0.01.
6. **Subplot (f): # Articulation Points vs. Iteration**
- **Y-axis**: Count (range: 0 to 800)
- **X-axis**: Iteration (0 to 1000)
- **Legend**: Teal line
- **Key Features**: Linear increase from 0 to 800 over 1000 iterations.
---
### Detailed Analysis
- **(a) Degree Assortativity**: The metric begins at -0.25 (highly disassortative) and rises sharply to -0.15 by iteration 50. It then oscillates between -0.05 and -0.10, suggesting the network becomes moderately assortative but stabilizes.
- **(b) Global Transitivity**: Drops from 0.35 (high clustering) to 0.10 (low clustering) by iteration 300, indicating reduced local connectivity over time.
- **(c) Max k-Core Index**: Increases stepwise, reflecting the emergence of higher-order cohesive substructures. The final value of 11 suggests a robust core persists after 1000 iterations.
- **(d) Largest k-Core Size**: Peaks at 70 nodes (iteration 600), then collapses to 30 (iteration 800), implying a critical threshold where the core disintegrates.
- **(e) Avg Betweenness**: Declines from 0.14 (high centrality) to near 0, indicating reduced reliance on hub nodes for information flow.
- **(f) Articulation Points**: Linearly increases to 800, suggesting growing network fragility as more nodes become critical for connectivity.
---
### Key Observations
1. **Contrasting Trends**: While transitivity and betweenness decline, articulation points and max k-core index increase, highlighting divergent network dynamics.
2. **Critical Thresholds**: The abrupt drop in largest k-core size (subplot d) at iteration 800 suggests a phase transition in network structure.
3. **Linear Growth**: Articulation points (subplot f) show no saturation, implying continuous vulnerability to node removal.
---
### Interpretation
The data suggests a network undergoing structural reorganization:
- **Early Iterations (0–300)**: High transitivity and betweenness indicate dense, clustered networks. Negative assortativity implies heterogeneous degree distribution.
- **Mid-Iterations (300–600)**: Stabilization of assortativity and transitivity suggests a shift toward modularity. The emergence of a large k-core (subplot d) reflects growing cohesion.
- **Late Iterations (600–1000)**: The collapse of the largest k-core (subplot d) and rising articulation points (subplot f) imply fragmentation. The persistent max k-core (subplot c) indicates a resilient core persists despite overall disintegration.
These trends align with models of network evolution where initial clustering gives way to modularity, followed by fragmentation. The linear growth of articulation points (subplot f) raises concerns about scalability, as critical nodes become increasingly numerous.