## Diagram: Matrix Multiplication and Summation Tree
### Overview
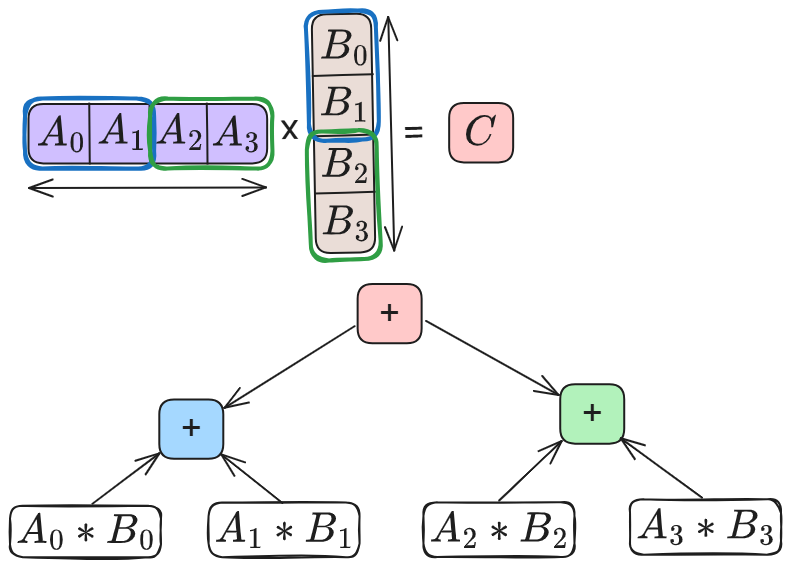
The image depicts a matrix multiplication operation followed by a summation tree. It illustrates how the elements of two matrices, A and B, are multiplied and then summed to produce a scalar result, C. The diagram shows the multiplication of corresponding elements and their subsequent addition in a tree-like structure.
### Components/Axes
* **Matrices:**
* Matrix A: A horizontal array of elements A0, A1, A2, A3. The entire matrix is enclosed in a blue rounded rectangle, with A2 and A3 also enclosed in a green rounded rectangle. A horizontal double-headed arrow indicates the dimension of the matrix.
* Matrix B: A vertical array of elements B0, B1, B2, B3. The entire matrix is enclosed in a blue rounded rectangle, with B2 and B3 also enclosed in a green rounded rectangle. A vertical double-headed arrow indicates the dimension of the matrix.
* **Result:**
* C: A scalar result represented by the variable C, enclosed in a pink rounded rectangle.
* **Operations:**
* Multiplication: Represented by the "x" symbol between matrices A and B.
* Equality: Represented by the "=" symbol between the matrix multiplication and the result C.
* Multiplication Nodes: Four rounded rectangles containing the multiplication of corresponding elements: A0 * B0, A1 * B1, A2 * B2, A3 * B3.
* Summation Nodes: Two rounded rectangles containing "+" symbols, one blue and one green, representing addition operations. A final pink rounded rectangle containing a "+" symbol represents the final summation.
* **Flow:** Arrows indicate the flow of data from the multiplication nodes to the summation nodes, and finally to the result.
### Detailed Analysis
1. **Matrix Multiplication:**
* Matrix A: [A0, A1, A2, A3]
* Matrix B: [B0, B1, B2, B3] (arranged vertically)
* The multiplication is represented as A x B = C.
2. **Summation Tree:**
* The multiplication results (A0\*B0, A1\*B1, A2\*B2, A3\*B3) are inputs to the summation tree.
* A0\*B0 and A1\*B1 are added together in a blue node.
* A2\*B2 and A3\*B3 are added together in a green node.
* The results of the blue and green nodes are added together in a pink node to produce the final result C.
### Key Observations
* The diagram illustrates a specific case of matrix multiplication where the result is a scalar.
* The summation tree shows a parallel addition process, where pairs of multiplication results are added simultaneously.
* The colors (blue, green, pink) highlight the different stages or groups of operations.
### Interpretation
The diagram demonstrates a method for computing the dot product of two vectors (represented as matrices A and B). The multiplication of corresponding elements is followed by a summation of these products. The summation tree structure suggests a parallel computation approach, which can be more efficient than a sequential addition, especially for large matrices. The diagram effectively visualizes the mathematical operations and their relationships, providing a clear understanding of the computation process.