\n
## Diagram: Matrix Multiplication Decomposition
### Overview
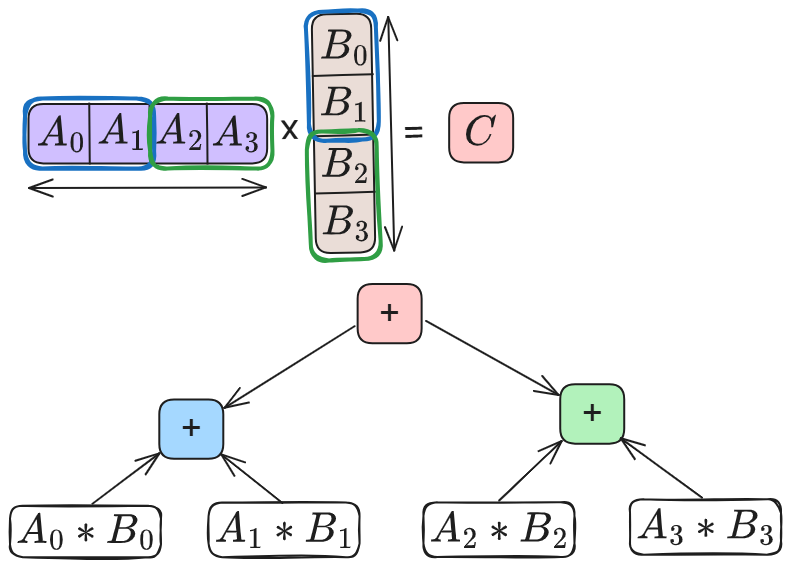
The image depicts a visual representation of matrix multiplication, breaking down the process into its constituent element-wise multiplications and additions. It shows a matrix multiplication operation (A x B = C) and then expands this into a series of smaller addition operations, illustrating how the resulting matrix C is computed.
### Components/Axes
The diagram consists of the following components:
* **Matrix A:** Represented as a horizontal row of four elements: A₀, A₁, A₂, A₃. Enclosed in a light blue rectangle.
* **Matrix B:** Represented as a vertical column of four elements: B₀, B₁, B₂, B₃. Enclosed in a light green rectangle.
* **Matrix C:** Represented as a single element: C. Enclosed in a pink rectangle.
* **Multiplication and Addition Operations:** A series of rectangular boxes with "+" signs inside, representing addition operations.
* **Element-wise Products:** Boxes containing terms like A₀ * B₀, A₁ * B₁, etc., representing the product of individual elements from matrices A and B.
* **Arrows:** Indicate the flow of data and the order of operations.
### Detailed Analysis or Content Details
The diagram illustrates the following breakdown of the matrix multiplication A x B = C:
1. **Element-wise Multiplication:**
* A₀ is multiplied by B₀, resulting in A₀ * B₀.
* A₁ is multiplied by B₁, resulting in A₁ * B₁.
* A₂ is multiplied by B₂, resulting in A₂ * B₂.
* A₃ is multiplied by B₃, resulting in A₃ * B₃.
2. **First Level Addition:**
* A₀ * B₀ and A₁ * B₁ are added together in a box labeled "+".
3. **Second Level Addition:**
* A₂ * B₂ and A₃ * B₃ are added together in a box labeled "+".
4. **Final Addition:**
* The results of the two first-level additions are then added together in a box labeled "+", resulting in C.
The arrows show the flow of data: from the element-wise products to the first-level additions, and then to the final addition, which produces the element C.
### Key Observations
The diagram clearly demonstrates how matrix multiplication can be decomposed into a series of scalar multiplications and additions. The structure highlights the parallel nature of the computation, where multiple element-wise products can be calculated simultaneously before being summed.
### Interpretation
This diagram is a visual aid for understanding the fundamental operation of matrix multiplication. It's a common technique used in linear algebra to explain how matrices interact and how their elements contribute to the final result. The decomposition into smaller operations is crucial for understanding the computational complexity of matrix multiplication and for optimizing its implementation in software and hardware. The diagram emphasizes that matrix multiplication isn't a single operation, but a structured sequence of simpler operations. This is particularly important when considering large matrices, where efficient implementation is critical. The diagram is a pedagogical tool, designed to make the abstract concept of matrix multiplication more concrete and accessible.