## Scatter Plot: human_sexuality
### Overview
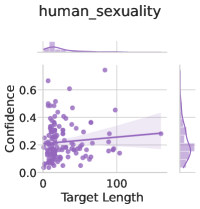
The image is a scatter plot titled "human_sexuality". It displays the relationship between "Target Length" on the x-axis and "Confidence" on the y-axis. The plot includes a regression line with a confidence interval. Density plots are shown along the top and right edges of the scatter plot.
### Components/Axes
* **Title:** human_sexuality
* **X-axis:** Target Length
* Scale ranges from 0 to approximately 100.
* **Y-axis:** Confidence
* Scale ranges from 0.0 to 0.6.
* **Data Points:** Purple dots representing individual data points.
* **Regression Line:** A purple line showing the linear regression fit to the data.
* **Confidence Interval:** A shaded purple region around the regression line, indicating the confidence interval.
* **Marginal Density Plots:** Density plots along the top (for Target Length) and right (for Confidence) axes.
### Detailed Analysis
* **Data Point Distribution:** The data points are concentrated near the lower-left corner of the plot, indicating that most data points have low target lengths and low confidence values.
* **Regression Line:** The regression line has a slight positive slope, suggesting a weak positive correlation between Target Length and Confidence.
* **Confidence Interval:** The confidence interval widens as Target Length increases, indicating greater uncertainty in the regression line's prediction for larger target lengths.
* **Marginal Density Plots:**
* The density plot for Target Length shows a high concentration of values near zero.
* The density plot for Confidence shows a peak near 0.1, indicating that most data points have low confidence values.
### Key Observations
* Most data points have low target lengths and low confidence values.
* There is a weak positive correlation between Target Length and Confidence.
* The uncertainty in the regression line's prediction increases as Target Length increases.
### Interpretation
The scatter plot suggests that there is a weak positive relationship between Target Length and Confidence in the context of "human_sexuality". However, the concentration of data points at low values and the widening confidence interval indicate that this relationship may not be strong or reliable. The marginal density plots confirm that both Target Length and Confidence tend to be low for most data points. The data suggests that longer target lengths are associated with slightly higher confidence, but this trend is not definitive.