\n
## Scatter Plot: Human Sexuality Confidence vs. Target Length
### Overview
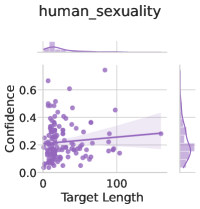
The image is a scatter plot with marginal distribution plots (histograms/density curves) on the top and right sides. The chart visualizes the relationship between "Target Length" (x-axis) and "Confidence" (y-axis) for a dataset labeled "human_sexuality". The data points are represented as purple dots, and a linear trend line with a shaded confidence interval is overlaid.
### Components/Axes
* **Title:** `human_sexuality` (centered at the top).
* **Y-Axis:**
* **Label:** `Confidence`
* **Scale:** Linear, ranging from `0.0` to `0.6`. Major tick marks are at `0.0`, `0.2`, `0.4`, and `0.6`.
* **X-Axis:**
* **Label:** `Target Length`
* **Scale:** Linear, ranging from `0` to `100`. Major tick marks are at `0` and `100`.
* **Data Series:**
* **Points:** Numerous purple circular markers representing individual data points.
* **Trend Line:** A solid purple line showing a linear regression fit.
* **Confidence Band:** A semi-transparent purple shaded area around the trend line, representing the uncertainty of the fit.
* **Marginal Distributions:**
* **Top (for Target Length):** A density curve/histogram showing the distribution of the x-axis variable. It is heavily right-skewed, with the highest density near 0.
* **Right (for Confidence):** A density curve/histogram showing the distribution of the y-axis variable. It is also right-skewed, with the highest density between approximately 0.1 and 0.3.
### Detailed Analysis
* **Data Point Distribution:** The majority of data points are densely clustered in the lower-left quadrant of the plot. Specifically:
* **Target Length:** Most points fall between `0` and `~50`, with the highest concentration between `0` and `20`.
* **Confidence:** Most points fall between `0.0` and `0.4`, with the highest concentration between `0.1` and `0.3`.
* **Trend Line:** The purple trend line exhibits a **slight positive slope**. It starts at a Confidence value of approximately `0.2` when Target Length is `0` and rises to a Confidence value of approximately `0.25` when Target Length is `100`.
* **Confidence Interval:** The shaded confidence band is narrowest near the center of the data mass (low Target Length) and widens considerably as Target Length increases, indicating greater uncertainty in the trend for larger target lengths due to sparse data.
* **Outliers:** There are a few notable outliers:
* One point with a very high Confidence value of approximately `0.65` at a Target Length of about `40`.
* Several points with Target Lengths approaching or exceeding `100`, but with relatively low Confidence values (below `0.3`).
### Key Observations
1. **Weak Positive Correlation:** The data suggests a very weak positive relationship between Target Length and Confidence. As the target length increases, confidence shows a slight tendency to increase.
2. **Data Sparsity:** The dataset is heavily skewed towards shorter target lengths. There are very few data points with a Target Length greater than `50`, making any conclusions about that range highly uncertain.
3. **Concentration of Confidence:** The bulk of the confidence scores are low to moderate, clustered below `0.4`. High confidence scores (above `0.5`) are rare.
4. **Distribution Shape:** Both variables have right-skewed distributions, as shown by the marginal plots. This means most observations have low values for both Target Length and Confidence.
### Interpretation
The chart demonstrates that for the "human_sexuality" dataset, the length of a target (e.g., a text passage, a query) has only a marginal and statistically weak influence on the model's confidence in its output. The primary takeaway is that **confidence is generally low to moderate regardless of target length**.
The weak positive trend might suggest that slightly longer contexts provide a tiny bit more information for the model to be confident, but the effect is minimal. The more significant finding is the data sparsity and skew: the evaluation or dataset is dominated by short targets, and the model rarely exhibits high confidence. The widening confidence band for longer targets is a critical visual cue that we cannot reliably infer the relationship in that region. The outlier with very high confidence at a moderate target length is an interesting case that might warrant individual inspection to understand what made that instance different. Overall, the chart indicates that target length is not a strong predictor of confidence for this specific task or model.