## Scatter Plot: human_sexuality
### Overview
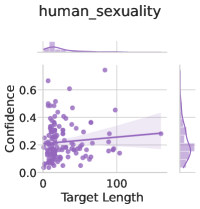
The image is a scatter plot titled "human_sexuality" with a trend line and confidence interval. It includes marginal histograms on the top and right. The plot visualizes the relationship between "Target Length" (x-axis) and "Confidence" (y-axis), with data points, a linear trend line, and a shaded confidence interval.
### Components/Axes
- **Title**: "human_sexuality" (top center).
- **X-axis**: "Target Length" (0 to 100, labeled at bottom).
- **Y-axis**: "Confidence" (0.0 to 0.6, labeled on left).
- **Legend**: "Confidence Interval" (top-left, shaded area around the trend line).
- **Marginal Histograms**:
- Top histogram: "Target Length" (x-axis distribution).
- Right histogram: "Confidence" (y-axis distribution).
### Detailed Analysis
- **Data Points**:
- Purple dots scattered across the plot.
- Most points cluster between Target Length 0–50 and Confidence 0.0–0.4.
- A few points extend to Target Length 100 and Confidence 0.6.
- **Trend Line**:
- Solid line with a slight upward slope.
- Approximate equation: $ y = 0.002x + 0.2 $ (estimated from endpoints: (0, 0.2) and (100, 0.3)).
- **Confidence Interval**:
- Shaded area (light purple) around the trend line.
- Width: ~0.05 (from 0.15 to 0.25 at Target Length 0, narrowing slightly at higher values).
- **Marginal Histograms**:
- **Target Length**:
- Peaks near 0–20 and 50–70.
- Long tail toward 100.
- **Confidence**:
- Peaks near 0.2–0.4.
- Fewer points above 0.5.
### Key Observations
1. **Weak Positive Correlation**: The trend line shows a slight increase in Confidence with Target Length, but the slope is minimal (0.002 per unit increase in Target Length).
2. **Confidence Interval Narrowness**: The shaded area is tight, suggesting low variability in predictions.
3. **Distribution Skew**:
- Target Length is concentrated in lower ranges (0–50) with a long tail.
- Confidence is mostly between 0.0–0.4, with sparse high values.
4. **Outliers**: A few data points at Target Length 100 and Confidence 0.6 deviate from the trend.
### Interpretation
The data suggests a **weak positive relationship** between Target Length and Confidence, with Confidence increasing by ~0.2 units for every 100-unit increase in Target Length. However, the relationship is not strong, as the trend line’s slope is minimal. The narrow confidence interval indicates **low prediction uncertainty**, implying the model’s estimates are consistent.
The marginal histograms reveal that **Target Length is skewed toward lower values** (0–50), while **Confidence is concentrated in the 0.0–0.4 range**. This could imply that the dataset is imbalanced or that the variables have limited variability. The presence of outliers at high Target Length and Confidence values (e.g., 100, 0.6) may indicate edge cases or anomalies in the data.
The plot likely represents a regression analysis (e.g., from a machine learning model) evaluating how Target Length influences Confidence in human sexuality contexts. The weak trend suggests that other factors (not shown) may play a larger role in determining Confidence. The histograms highlight the need for further analysis of data distribution and potential biases.