## Scatter Plot Grid: Performance vs. Mean Token Length
### Overview
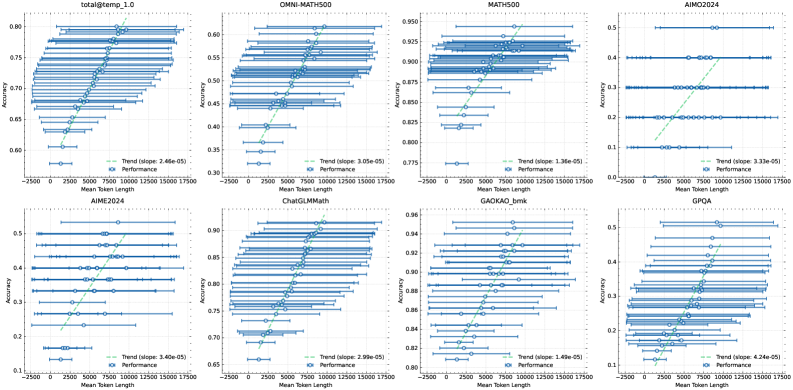
The image presents a grid of eight scatter plots, each displaying the relationship between "Accuracy" and "Mean Token Length" for different datasets or models. Each plot includes data points representing performance, error bars, and a trend line with its slope indicated.
### Components/Axes
* **X-axis (Horizontal):** "Mean Token Length". The scale ranges from approximately -2500 to 17500, with tick marks at intervals of 2500.
* **Y-axis (Vertical):** "Accuracy". The scale varies across plots, but generally ranges from 0 to 1, with varying tick mark intervals.
* **Data Points:** Blue circles represent individual data points, indicating the accuracy at a specific mean token length.
* **Error Bars:** Horizontal lines extending from each data point, indicating the range or variability in the mean token length.
* **Trend Line:** A dashed green line indicates the general trend of the data. The slope of this line is noted in the legend.
* **Legend:** Located in the bottom-right corner of each plot, the legend identifies the data points as "Performance" and the dashed line as "Trend (slope: [value])".
* **Plot Titles:** Each plot has a title indicating the dataset or model being analyzed (e.g., "total@temp\_1.0", "OMNI-MATH500", "MATH500", "AIMO2024", "AIME2024", "ChatGLMMath", "GAOKAO\_bmk", "GPQA").
### Detailed Analysis
Each plot is analyzed individually:
1. **total@temp\_1.0:**
* Accuracy ranges from approximately 0.6 to 0.8.
* The trend line slopes upward, with a slope of 2.46e-05.
* Data points are clustered, showing an increase in accuracy as mean token length increases.
2. **OMNI-MATH500:**
* Accuracy ranges from approximately 0.3 to 0.6.
* The trend line slopes upward, with a slope of 3.05e-05.
* Data points are more scattered compared to "total@temp\_1.0".
3. **MATH500:**
* Accuracy ranges from approximately 0.775 to 0.95.
* The trend line slopes upward, with a slope of 1.36e-05.
* Data points are relatively high, indicating good performance.
4. **AIMO2024:**
* Accuracy ranges from approximately 0.0 to 0.5.
* The trend line slopes upward, with a slope of 3.33e-05.
* Data points are more spread out, with lower accuracy values.
5. **AIME2024:**
* Accuracy ranges from approximately 0.1 to 0.5.
* The trend line slopes upward, with a slope of 3.40e-05.
* Data points show a moderate increase in accuracy with increasing token length.
6. **ChatGLMMath:**
* Accuracy ranges from approximately 0.65 to 0.96.
* The trend line slopes upward, with a slope of 2.99e-05.
* Data points are clustered towards higher accuracy values.
7. **GAOKAO\_bmk:**
* Accuracy ranges from approximately 0.8 to 0.96.
* The trend line slopes upward, with a slope of 1.49e-05.
* Data points are tightly grouped, indicating consistent performance.
8. **GPQA:**
* Accuracy ranges from approximately 0.1 to 0.5.
* The trend line slopes upward, with a slope of 4.24e-05.
* Data points are more scattered, with a noticeable increase in accuracy as token length increases.
### Key Observations
* All plots show an upward trend, indicating a positive correlation between "Mean Token Length" and "Accuracy".
* The slopes of the trend lines vary, suggesting different degrees of impact from token length on accuracy across datasets/models.
* The range of accuracy values differs significantly between plots, indicating varying levels of performance for different datasets/models.
* The error bars indicate the variability in "Mean Token Length" for each data point.
### Interpretation
The data suggests that, in general, increasing the "Mean Token Length" tends to improve the "Accuracy" of the models or datasets being analyzed. However, the strength of this relationship varies, as indicated by the different slopes of the trend lines. Some datasets/models (e.g., MATH500, GAOKAO\_bmk, ChatGLMMath) exhibit higher overall accuracy compared to others (e.g., AIMO2024, GPQA), suggesting that they may be more robust or better suited for longer token lengths. The error bars provide insight into the stability of the "Mean Token Length" and can be used to assess the reliability of the observed trends. The different datasets likely represent different tasks or domains, which could explain the varying performance characteristics.