\n
## Charts: Model Performance vs. Token Length
### Overview
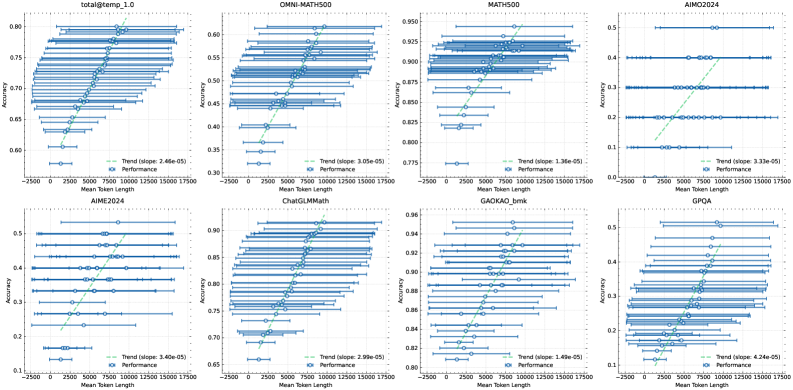
The image presents a 2x4 grid of line plots, each visualizing the relationship between "Accuracy" and "Mean Token Length" for different models. Each plot includes a blue line representing "Performance" (likely the model's accuracy) with error bars, and a green line representing the "Trend" (linear regression fit). The trend line's slope is also displayed in each plot.
### Components/Axes
Each chart shares the following components:
* **X-axis:** "Mean Token Length" ranging from approximately -2500 to 17500.
* **Y-axis:** "Accuracy" with varying scales depending on the model.
* **Blue Line with Error Bars:** Represents the "Performance" of the model. Error bars indicate the standard deviation or confidence interval around the performance.
* **Green Line:** Represents the "Trend" (linear regression) of the performance.
* **Text Label:** "Trend (slope: X.XXe-XX)" where X.XXe-XX is the slope of the trend line.
* **Legend:** Located in the bottom-left corner of each chart, labeling the blue line as "Performance" and the green line as "Trend".
The charts are labeled with the following model names (top row, left to right):
1. total@temp_1.0
2. OMNI-MATH500
3. MATH500
4. AIIM2024
(bottom row, left to right):
5. AIME2024
6. ChatGLMMath
7. GAOKAO_bmk
8. GPQA
### Detailed Analysis or Content Details
Here's a breakdown of each chart, extracting approximate values and trends:
1. **total@temp_1.0:**
* Accuracy range: ~0.60 to ~0.80
* Trend slope: 2.46e-05
* Performance: The blue line shows a generally increasing trend with increasing token length, but with significant fluctuations. Accuracy starts around 0.62 at -2500 tokens and reaches approximately 0.78 at 17500 tokens.
2. **OMNI-MATH500:**
* Accuracy range: ~0.38 to ~0.60
* Trend slope: 1.05e-05
* Performance: Similar to the first chart, the blue line shows an increasing trend, but with substantial variability. Accuracy starts around 0.40 at -2500 tokens and reaches approximately 0.58 at 17500 tokens.
3. **MATH500:**
* Accuracy range: ~0.775 to ~0.950
* Trend slope: 1.36e-05
* Performance: The blue line shows a clear increasing trend with increasing token length. Accuracy starts around 0.80 at -2500 tokens and reaches approximately 0.93 at 17500 tokens.
4. **AIIM2024:**
* Accuracy range: ~0.30 to ~0.50
* Trend slope: 2.35e-05
* Performance: The blue line shows a generally increasing trend, but with significant fluctuations. Accuracy starts around 0.35 at -2500 tokens and reaches approximately 0.45 at 17500 tokens.
5. **AIME2024:**
* Accuracy range: ~0.15 to ~0.55
* Trend slope: 1.40e-05
* Performance: The blue line shows a generally increasing trend, but with substantial variability. Accuracy starts around 0.20 at -2500 tokens and reaches approximately 0.50 at 17500 tokens.
6. **ChatGLMMath:**
* Accuracy range: ~0.70 to ~0.95
* Trend slope: 2.99e-05
* Performance: The blue line shows a clear increasing trend with increasing token length. Accuracy starts around 0.75 at -2500 tokens and reaches approximately 0.90 at 17500 tokens.
7. **GAOKAO_bmk:**
* Accuracy range: ~0.84 to ~0.96
* Trend slope: 1.26e-05
* Performance: The blue line shows a generally increasing trend with increasing token length. Accuracy starts around 0.85 at -2500 tokens and reaches approximately 0.94 at 17500 tokens.
8. **GPQA:**
* Accuracy range: ~0.30 to ~0.50
* Trend slope: 4.26e-05
* Performance: The blue line shows a generally increasing trend, but with significant fluctuations. Accuracy starts around 0.35 at -2500 tokens and reaches approximately 0.45 at 17500 tokens.
### Key Observations
* Most models exhibit a positive correlation between accuracy and mean token length, indicated by the upward-sloping trend lines.
* The magnitude of the slope varies significantly between models. GPQA and ChatGLMMath have the steepest slopes, suggesting a more pronounced increase in accuracy with longer token lengths.
* The error bars indicate substantial variance in performance, suggesting that the relationship between token length and accuracy is not always consistent.
* The accuracy scales differ significantly between models, making direct comparison challenging.
### Interpretation
The data suggests that, for most of these models, increasing the mean token length generally leads to improved accuracy. However, the extent of this improvement varies considerably. The positive slopes of the trend lines indicate that the models benefit from processing longer sequences of text. The large error bars suggest that other factors, beyond token length, also play a significant role in determining accuracy.
The differences in slopes could be attributed to the model architectures, training data, or the specific tasks they are designed for. Models with steeper slopes (e.g., GPQA, ChatGLMMath) might be more sensitive to context and benefit more from longer input sequences.
The varying accuracy scales suggest that the models are evaluated on different tasks or datasets with different difficulty levels. It would be valuable to normalize the accuracy scales to facilitate a more meaningful comparison of model performance.
The negative token lengths are unusual and likely represent some form of data preprocessing or encoding. Further investigation would be needed to understand their meaning.