## Line Chart: Pass@k (%) vs. k
### Overview
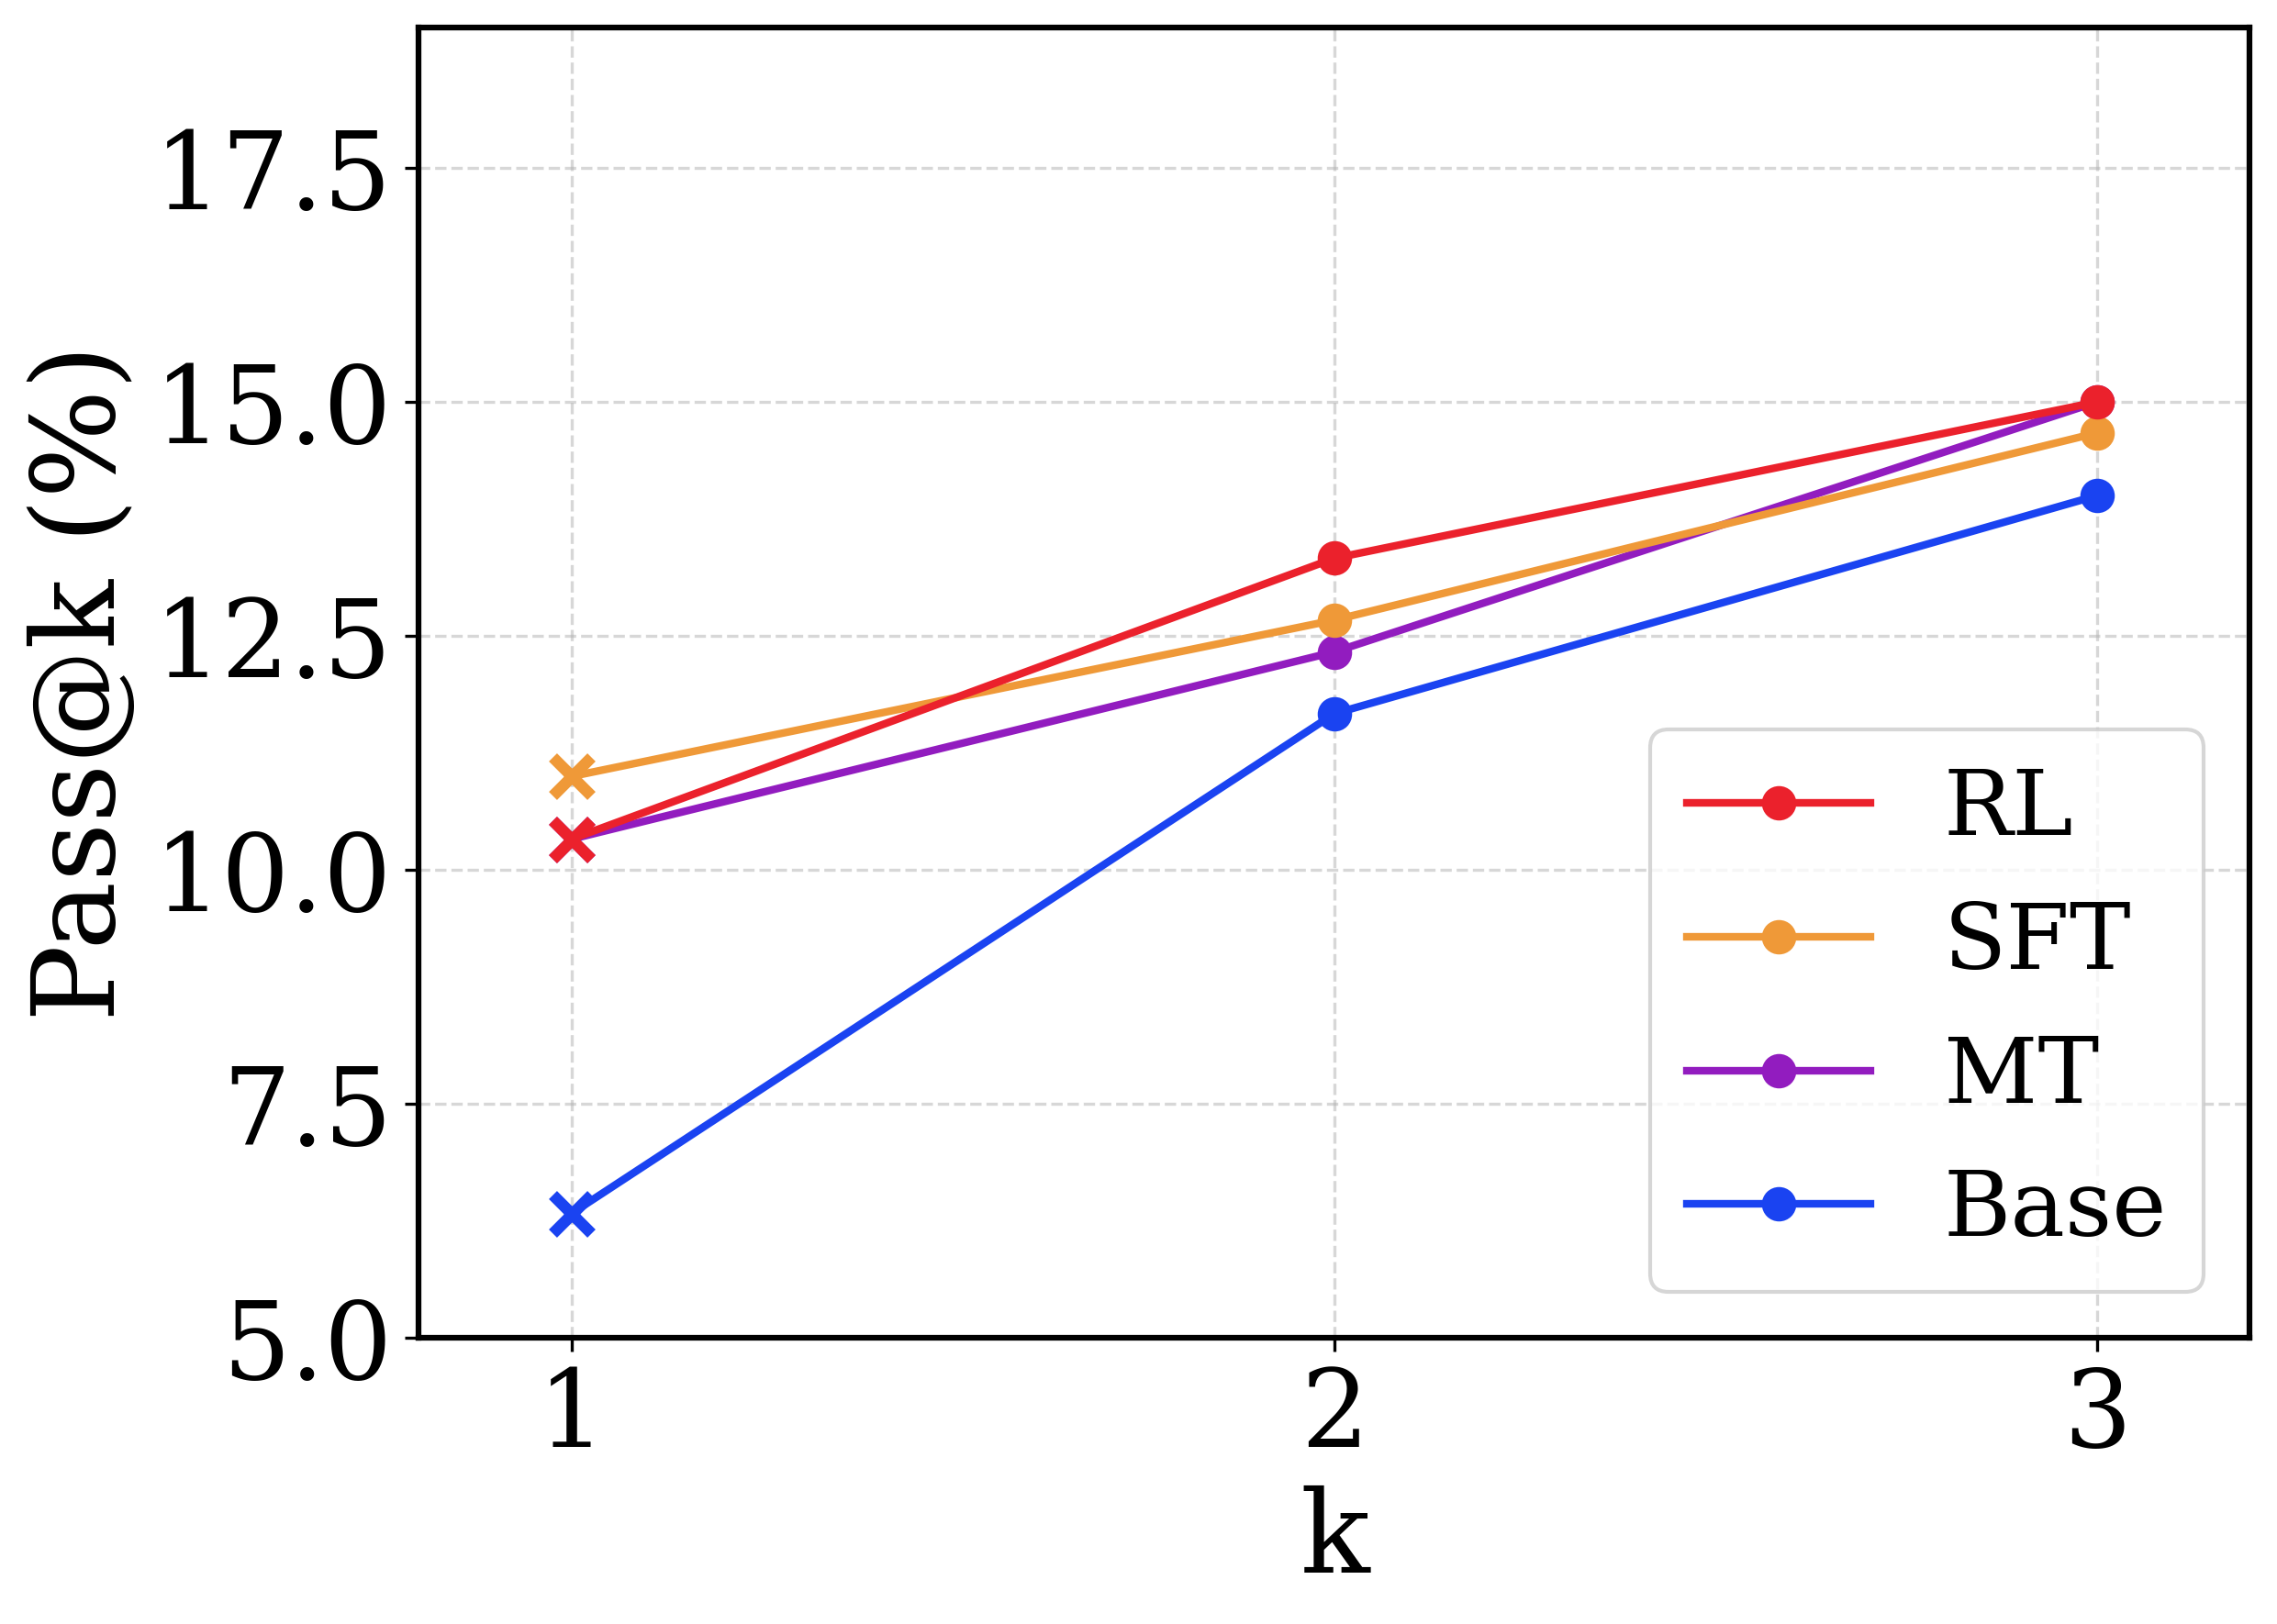
The image is a line chart comparing the performance of four different models (RL, SFT, MT, and Base) based on the "Pass@k (%)" metric for varying values of 'k' (1, 2, and 3). The chart displays how the performance of each model changes as 'k' increases.
### Components/Axes
* **X-axis:** 'k' with values 1, 2, and 3.
* **Y-axis:** "Pass@k (%)" ranging from 5.0 to 17.5, with increments of 2.5.
* **Legend:** Located on the right side of the chart, associating colors with model names:
* Red: RL
* Orange: SFT
* Purple: MT
* Blue: Base
### Detailed Analysis
* **RL (Red):** The red line represents the RL model.
* At k=1, Pass@k (%) is approximately 10.5%.
* At k=2, Pass@k (%) is approximately 13.5%.
* At k=3, Pass@k (%) is approximately 15.0%.
* Trend: The RL model's performance increases as 'k' increases.
* **SFT (Orange):** The orange line represents the SFT model.
* At k=1, Pass@k (%) is approximately 11.0%.
* At k=2, Pass@k (%) is approximately 12.5%.
* At k=3, Pass@k (%) is approximately 14.8%.
* Trend: The SFT model's performance increases as 'k' increases.
* **MT (Purple):** The purple line represents the MT model.
* At k=1, Pass@k (%) is approximately 10.5%.
* At k=2, Pass@k (%) is approximately 12.3%.
* At k=3, Pass@k (%) is approximately 14.5%.
* Trend: The MT model's performance increases as 'k' increases.
* **Base (Blue):** The blue line represents the Base model.
* At k=1, Pass@k (%) is approximately 6.3%.
* At k=2, Pass@k (%) is approximately 11.8%.
* At k=3, Pass@k (%) is approximately 14.0%.
* Trend: The Base model's performance increases as 'k' increases.
### Key Observations
* All four models show an increase in "Pass@k (%)" as 'k' increases from 1 to 3.
* The Base model starts with the lowest "Pass@k (%)" at k=1 but shows a significant increase, almost catching up with the other models at k=3.
* The RL model has the highest "Pass@k (%)" at k=3.
* The SFT and MT models have similar performance across all values of 'k'.
### Interpretation
The chart illustrates the impact of increasing 'k' on the "Pass@k (%)" metric for different models. The upward trend for all models suggests that increasing 'k' generally improves performance. The Base model's substantial improvement indicates that it benefits more from increasing 'k' compared to the other models. The RL model's consistently high performance suggests it is the most effective among the four, especially at higher values of 'k'. The similar performance of SFT and MT models implies that they have comparable effectiveness in this context.