\n
## Line Chart: Pass@k vs. k for Different Training Methods
### Overview
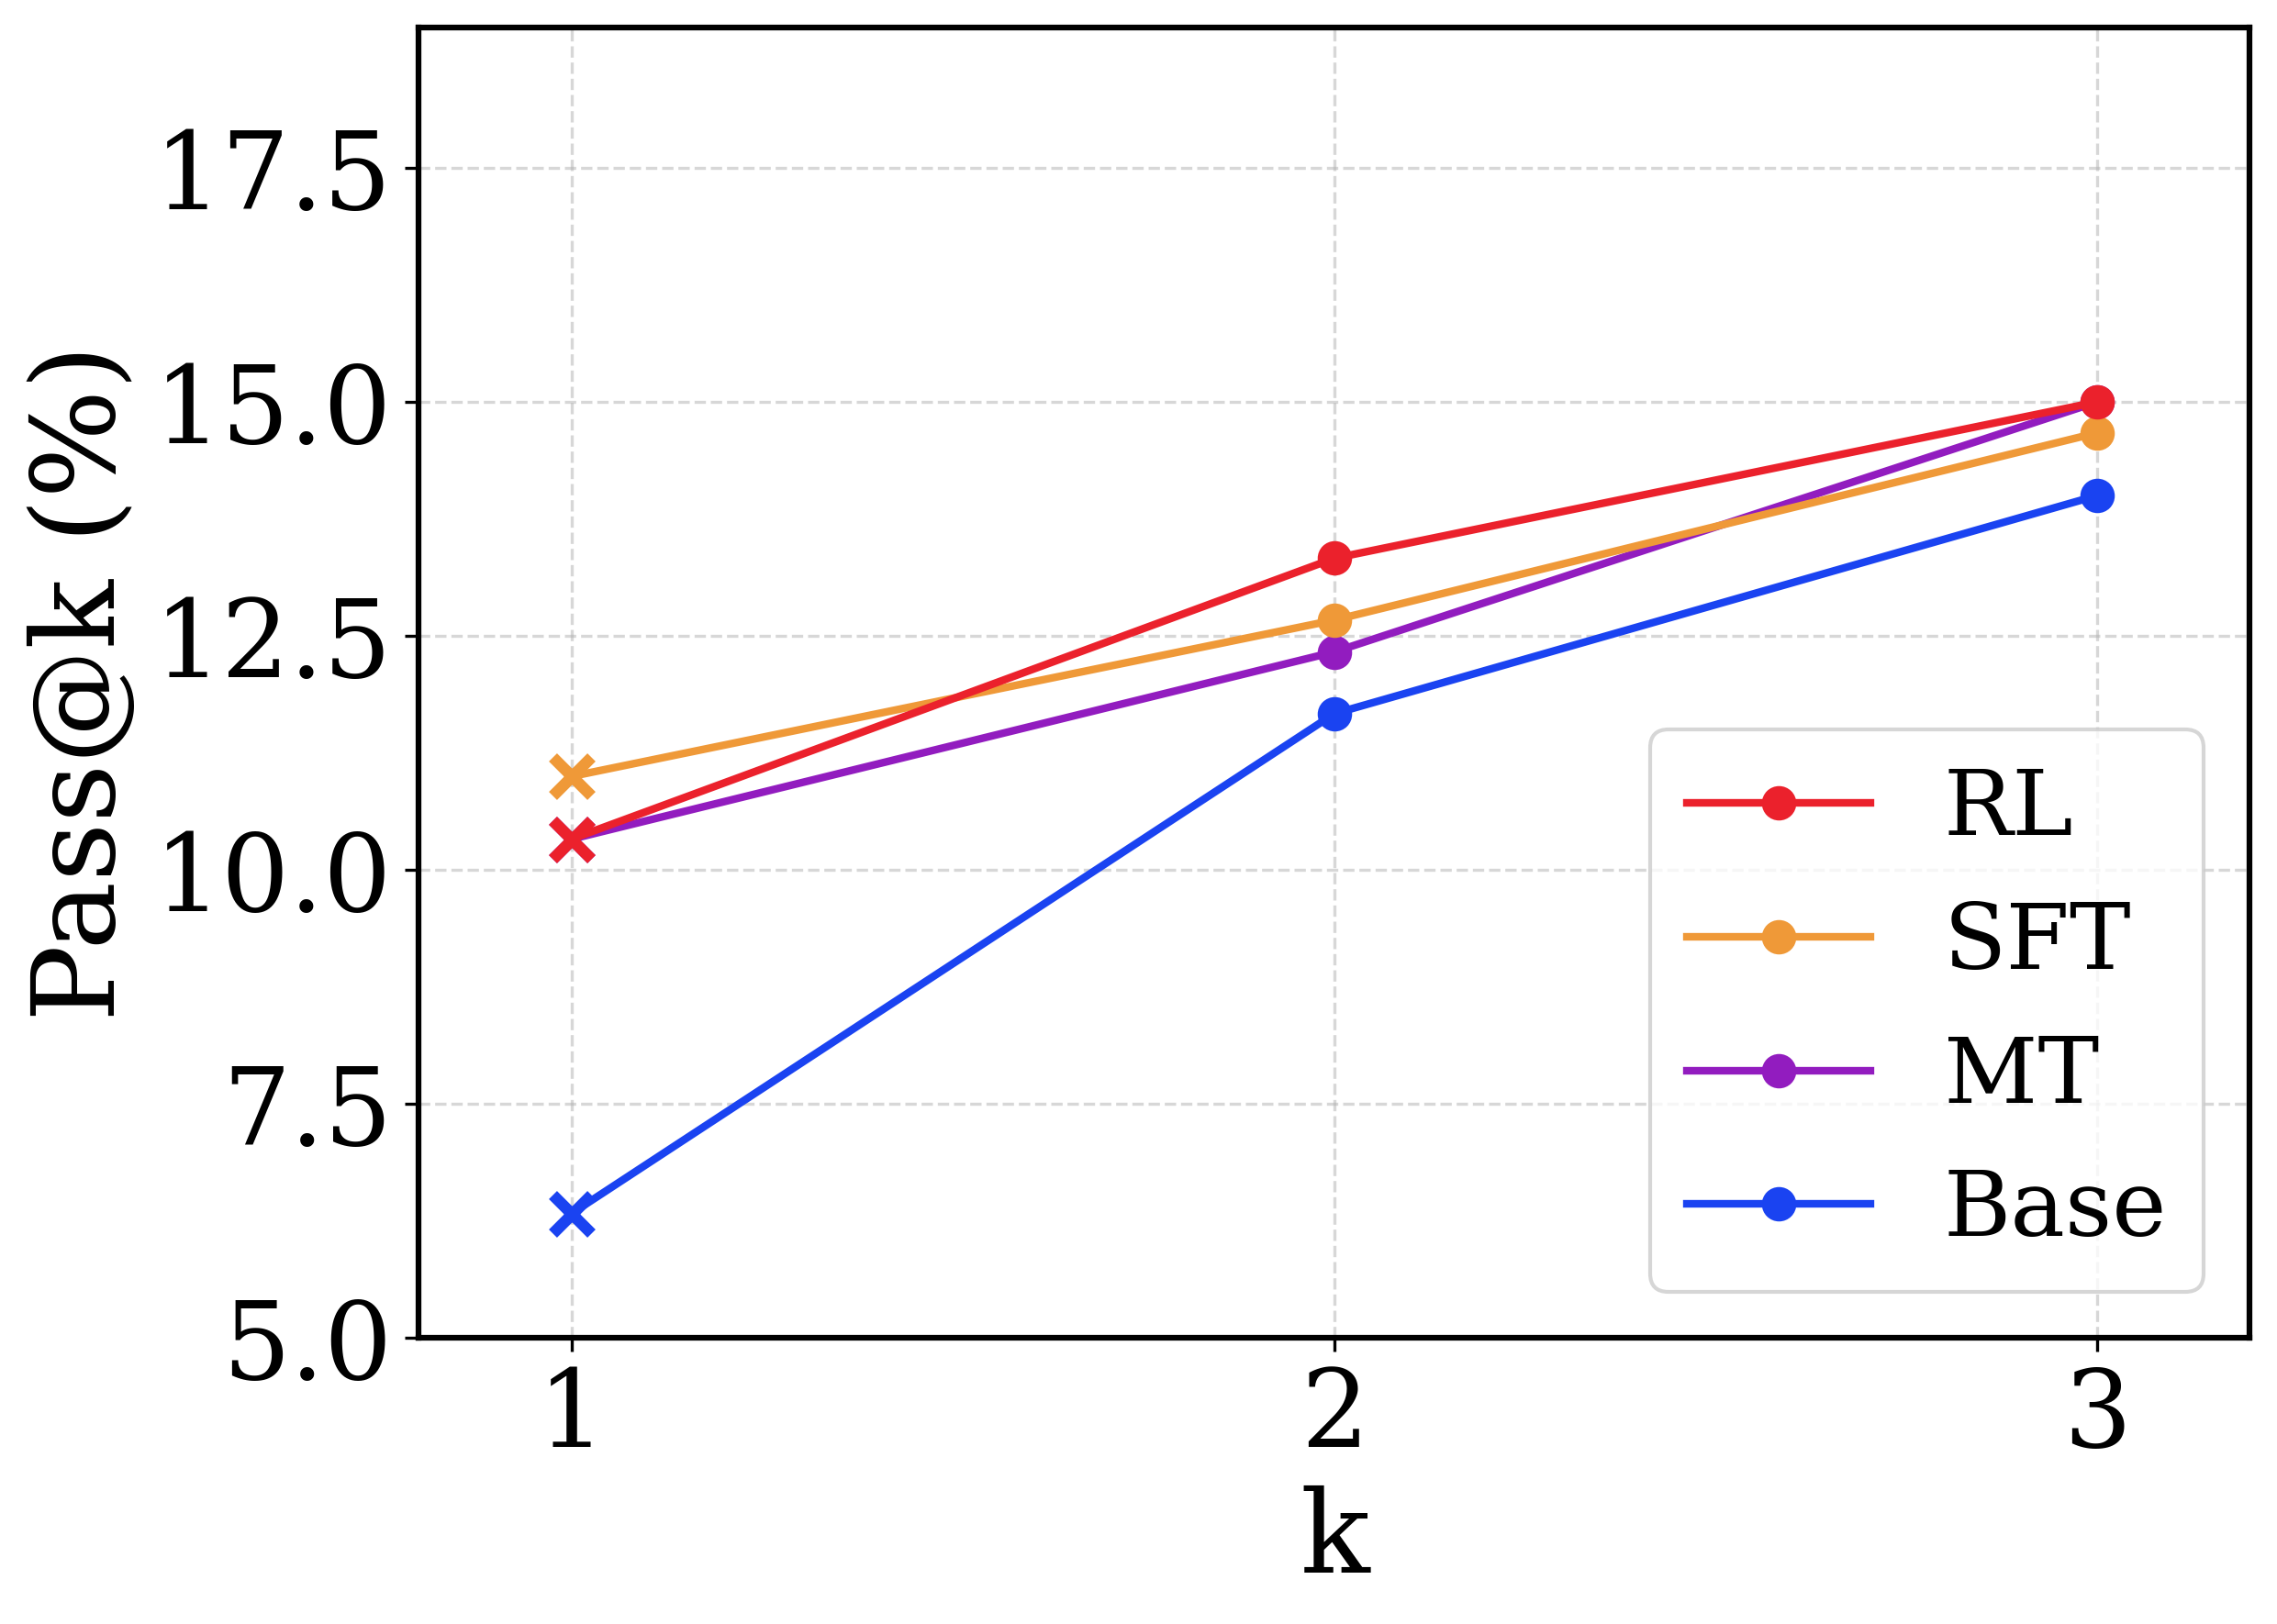
This image presents a line chart illustrating the relationship between the 'Pass@k' metric (expressed as a percentage) and the value of 'k' for four different training methods: RL, SFT, MT, and Base. The chart shows how the Pass@k performance changes as 'k' increases from 1 to 3.
### Components/Axes
* **X-axis:** Labeled "k", ranging from 1 to 3 with tick marks at each integer value.
* **Y-axis:** Labeled "Pass@k (%)", ranging from 5.0 to 17.5 with tick marks at 5.0, 7.5, 10.0, 12.5, 15.0, and 17.5.
* **Legend:** Located in the top-right corner, identifying the four data series:
* RL (Red)
* SFT (Orange)
* MT (Purple)
* Base (Blue)
* **Data Series:** Four distinct lines representing the Pass@k performance for each training method.
### Detailed Analysis
* **Base (Blue):** This line shows a consistent upward trend.
* At k=1, Pass@k is approximately 6.3%.
* At k=2, Pass@k is approximately 11.5%.
* At k=3, Pass@k is approximately 14.3%.
* **MT (Purple):** This line also shows an upward trend, but it appears to plateau slightly at k=3.
* At k=1, Pass@k is approximately 10.5%.
* At k=2, Pass@k is approximately 12.3%.
* At k=3, Pass@k is approximately 14.0%.
* **SFT (Orange):** This line exhibits an upward trend, starting higher than Base and MT at k=1.
* At k=1, Pass@k is approximately 11.3%.
* At k=2, Pass@k is approximately 13.3%.
* At k=3, Pass@k is approximately 14.7%.
* **RL (Red):** This line shows a consistent upward trend, starting slightly below SFT at k=1 and reaching the highest Pass@k value at k=3.
* At k=1, Pass@k is approximately 10.0%.
* At k=2, Pass@k is approximately 13.5%.
* At k=3, Pass@k is approximately 15.0%.
### Key Observations
* All four training methods demonstrate an increasing Pass@k performance as 'k' increases.
* The SFT method consistently achieves the highest Pass@k values across all 'k' values.
* The Base method starts with the lowest Pass@k value but shows a significant improvement as 'k' increases.
* The RL method shows the most consistent upward trend and reaches the highest Pass@k value at k=3.
### Interpretation
The chart suggests that increasing the value of 'k' generally improves the Pass@k metric for all four training methods. The SFT method appears to be the most effective in terms of achieving high Pass@k values, while the Base method shows the most substantial improvement with increasing 'k'. The RL method demonstrates a steady and consistent performance gain.
The Pass@k metric likely represents the proportion of times the model passes a test or meets a certain criteria within the top 'k' predictions. The 'k' parameter could represent the number of candidate solutions or predictions considered. The data indicates that exploring a larger number of candidates ('k') leads to better performance for all training methods, but the extent of improvement varies depending on the method used. The differences in performance between the methods suggest that the training strategies (RL, SFT, MT, Base) have varying impacts on the model's ability to generate accurate or relevant predictions.