## Line Chart: Pass@k Performance Comparison
### Overview
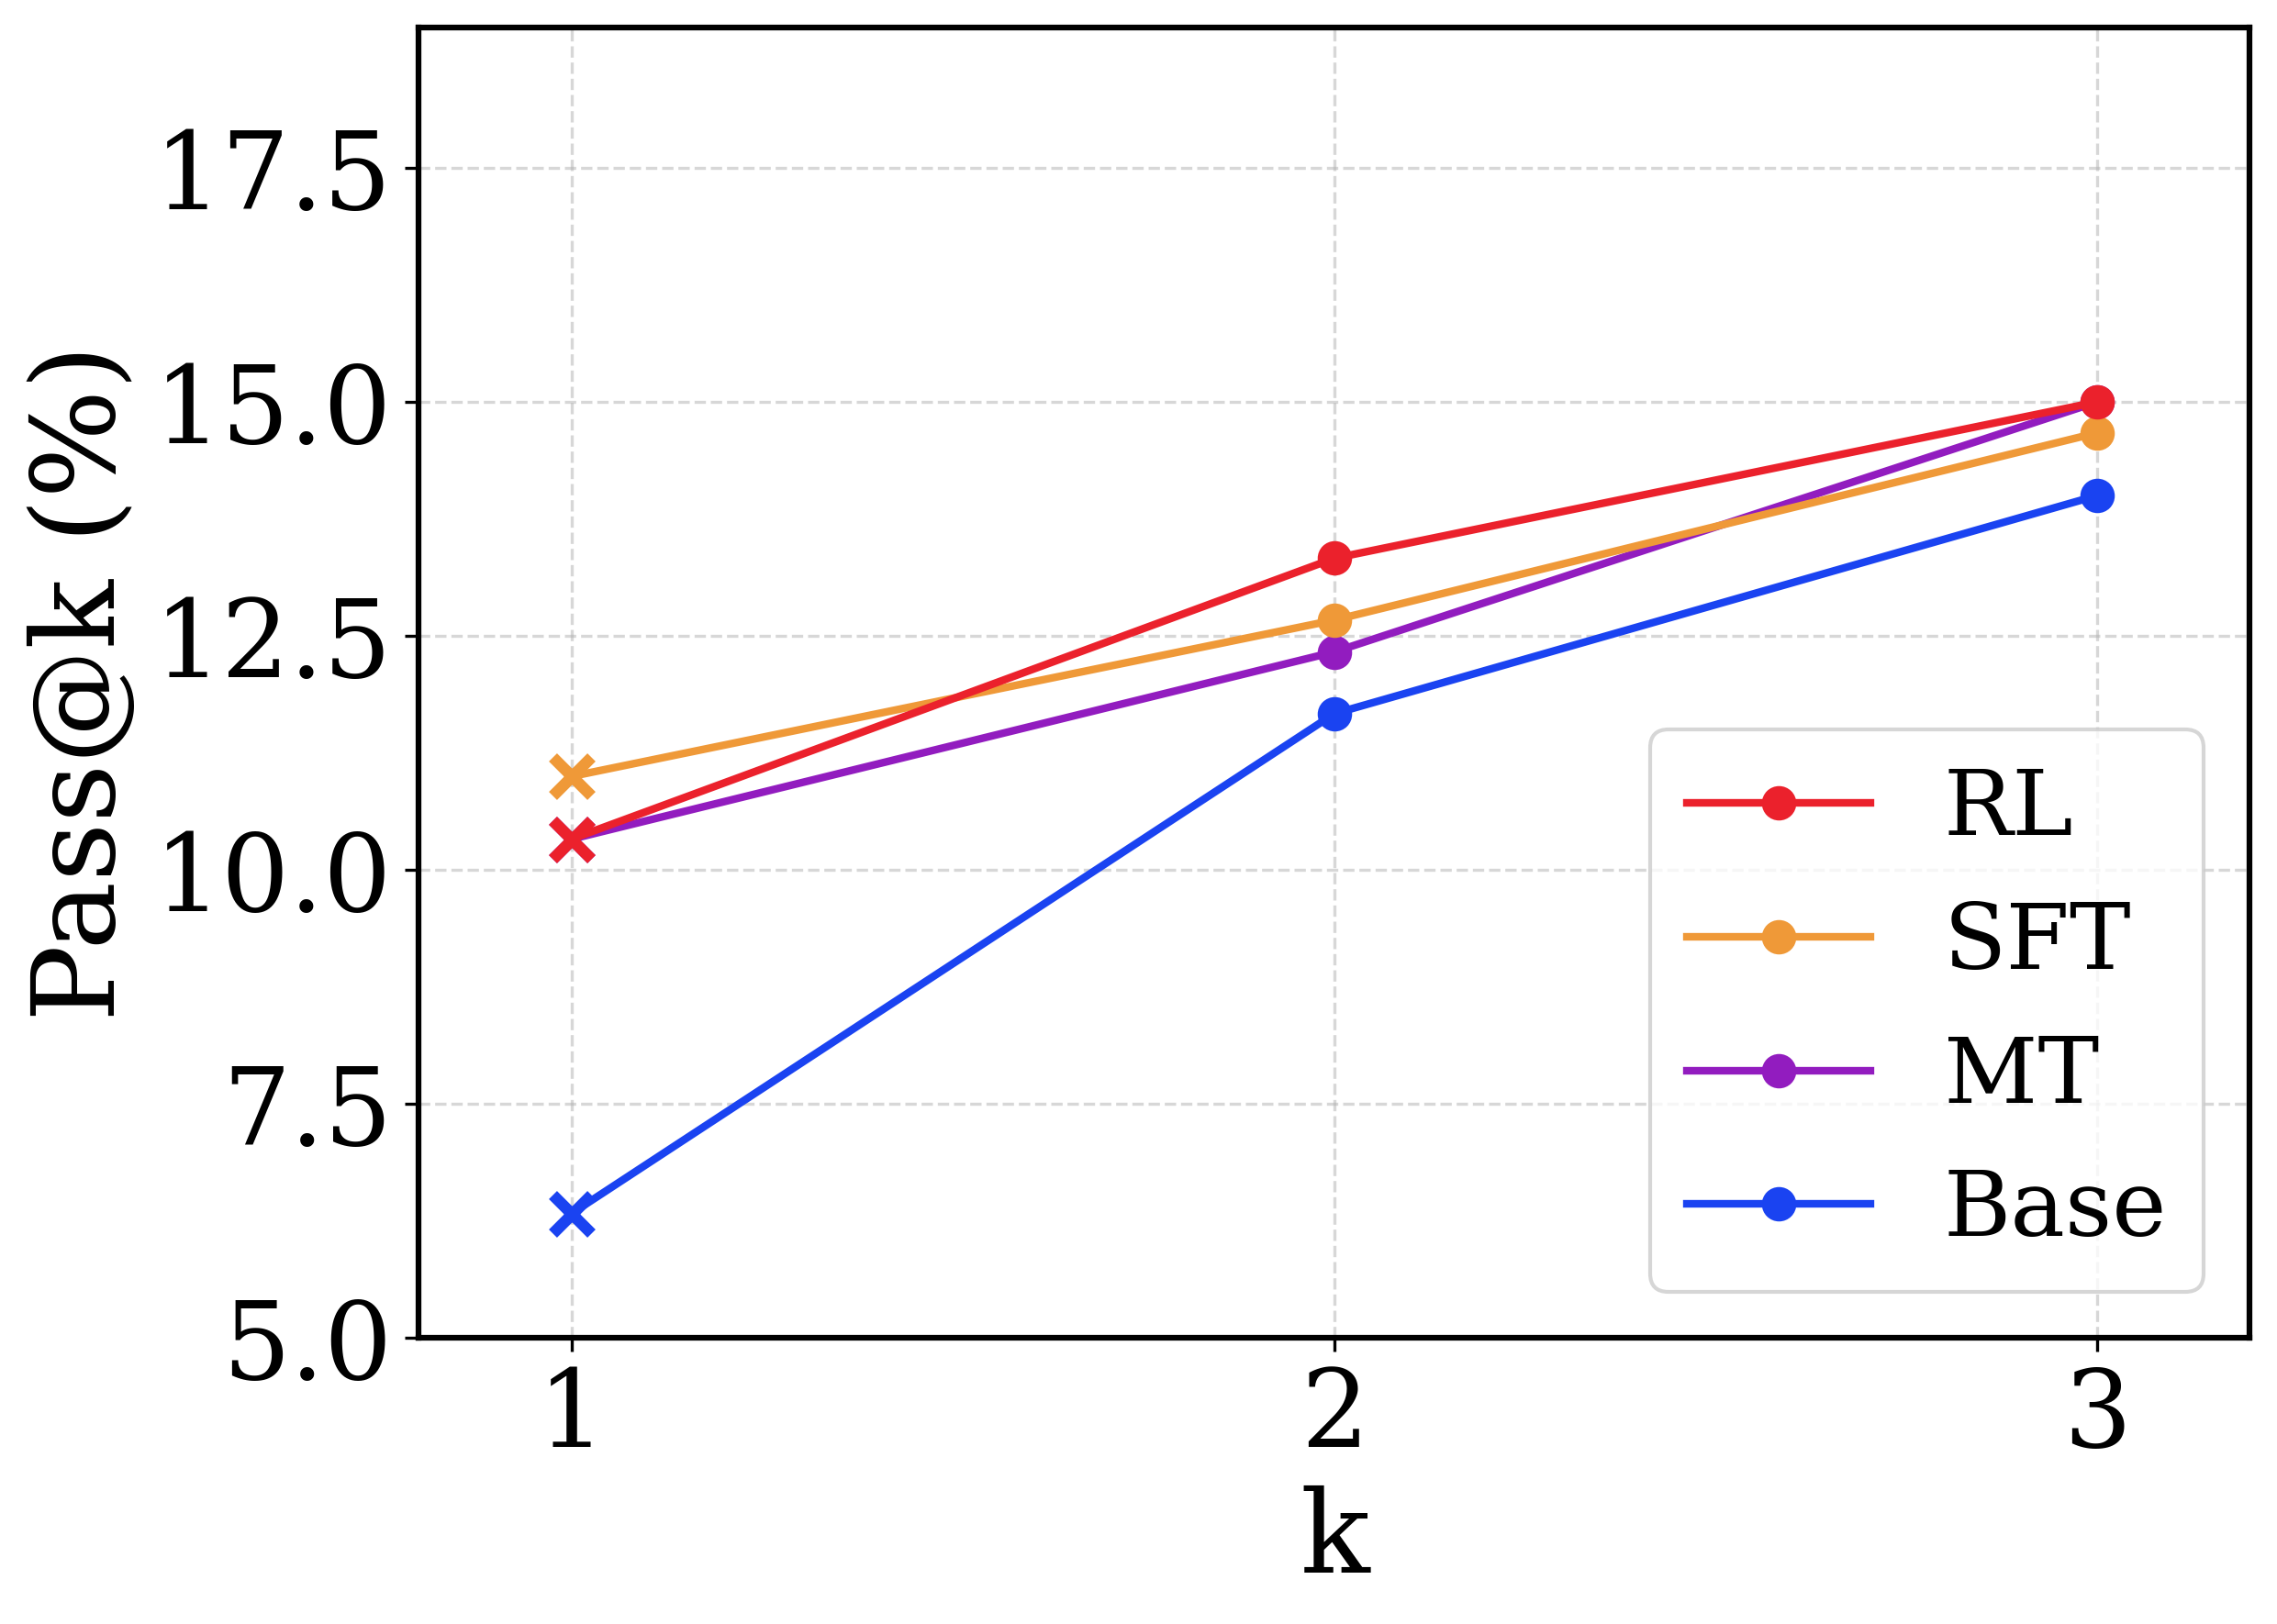
This image is a line chart comparing the performance of four different methods (RL, SFT, MT, Base) on a metric called "Pass@k (%)" across three values of k (1, 2, and 3). The chart demonstrates how the success rate of each method changes as the parameter k increases.
### Components/Axes
* **Chart Type:** Line chart with markers.
* **X-Axis:**
* **Label:** `k`
* **Scale:** Discrete values at 1, 2, and 3.
* **Y-Axis:**
* **Label:** `Pass@k (%)`
* **Scale:** Linear scale from 5.0 to 17.5, with major ticks at 5.0, 7.5, 10.0, 12.5, 15.0, and 17.5.
* **Legend:** Located in the bottom-right quadrant of the chart area. It contains four entries, each with a colored line and marker:
* **RL:** Red line with circular markers.
* **SFT:** Orange line with circular markers.
* **MT:** Purple line with circular markers.
* **Base:** Blue line with circular markers.
* **Data Point Markers:** The data points at `k=1` are marked with an 'x' symbol for all series. The data points at `k=2` and `k=3` are marked with solid circles.
### Detailed Analysis
The chart plots the Pass@k percentage for each method at k=1, 2, and 3. All values are approximate based on visual inspection of the chart.
**Trend Verification:** All four data series show a clear upward trend, with Pass@k increasing as k increases from 1 to 3.
**Data Series Breakdown:**
1. **RL (Red Line):**
* **Trend:** Steepest upward slope among all series.
* **Data Points:**
* k=1: ~10.5% (marked with red 'x')
* k=2: ~13.5%
* k=3: 15.0% (appears to be exactly on the grid line)
2. **SFT (Orange Line):**
* **Trend:** Steady upward slope, less steep than RL.
* **Data Points:**
* k=1: ~11.0% (marked with orange 'x') - This is the highest starting point.
* k=2: ~12.5%
* k=3: ~14.5%
3. **MT (Purple Line):**
* **Trend:** Steady upward slope, similar to SFT.
* **Data Points:**
* k=1: ~10.5% (marked with purple 'x') - Very close to RL's starting point.
* k=2: ~12.0%
* k=3: ~14.5% - Ends at approximately the same point as SFT.
4. **Base (Blue Line):**
* **Trend:** Steepest relative increase from its starting point.
* **Data Points:**
* k=1: ~6.5% (marked with blue 'x') - The lowest starting point by a significant margin.
* k=2: ~11.5%
* k=3: ~14.0%
### Key Observations
* **Performance Hierarchy at k=1:** SFT > RL ≈ MT > Base.
* **Performance Hierarchy at k=3:** RL > SFT ≈ MT > Base.
* **Convergence:** The performance gap between the methods narrows significantly as k increases. At k=1, the spread is ~4.5 percentage points (from ~6.5% to ~11.0%). At k=3, the spread is only ~1.0 percentage point (from ~14.0% to 15.0%).
* **RL's Overtake:** The RL method starts slightly below SFT at k=1 but surpasses it by k=2 and achieves the highest score at k=3.
* **Base Model's Improvement:** The Base model shows the most dramatic relative improvement, nearly catching up to the other methods by k=3 despite starting far behind.
### Interpretation
The chart illustrates a common evaluation scenario in fields like machine learning or code generation, where "Pass@k" measures the probability that at least one of k generated samples is correct. The data suggests several insights:
1. **Benefit of Multiple Attempts (k):** For all methods, allowing more attempts (increasing k) leads to a higher success rate. This is an expected and fundamental property of the Pass@k metric.
2. **Method Efficacy:** The RL (Reinforcement Learning) method demonstrates the strongest scaling behavior with k, ultimately yielding the best performance. SFT (Supervised Fine-Tuning) and MT (likely Multi-Task or another technique) show solid, comparable performance. The Base model, while starting poorly, benefits greatly from increased k, indicating its underlying capability is unlocked with more sampling.
3. **Diminishing Returns:** The convergence of lines at higher k suggests that the advantage of advanced training methods (RL, SFT, MT) over the Base model is most pronounced when only a single attempt (k=1) is allowed. When multiple attempts are permitted, the raw sampling capability of the base model can partially compensate for its lower initial quality.
4. **Practical Implication:** If the application allows for multiple attempts (high k), the choice of method may be less critical than if only a single attempt (k=1) is feasible. For single-attempt scenarios, investing in methods like SFT or RL provides a clear performance benefit.