# Technical Document Extraction: Line Chart Analysis
## Chart Overview
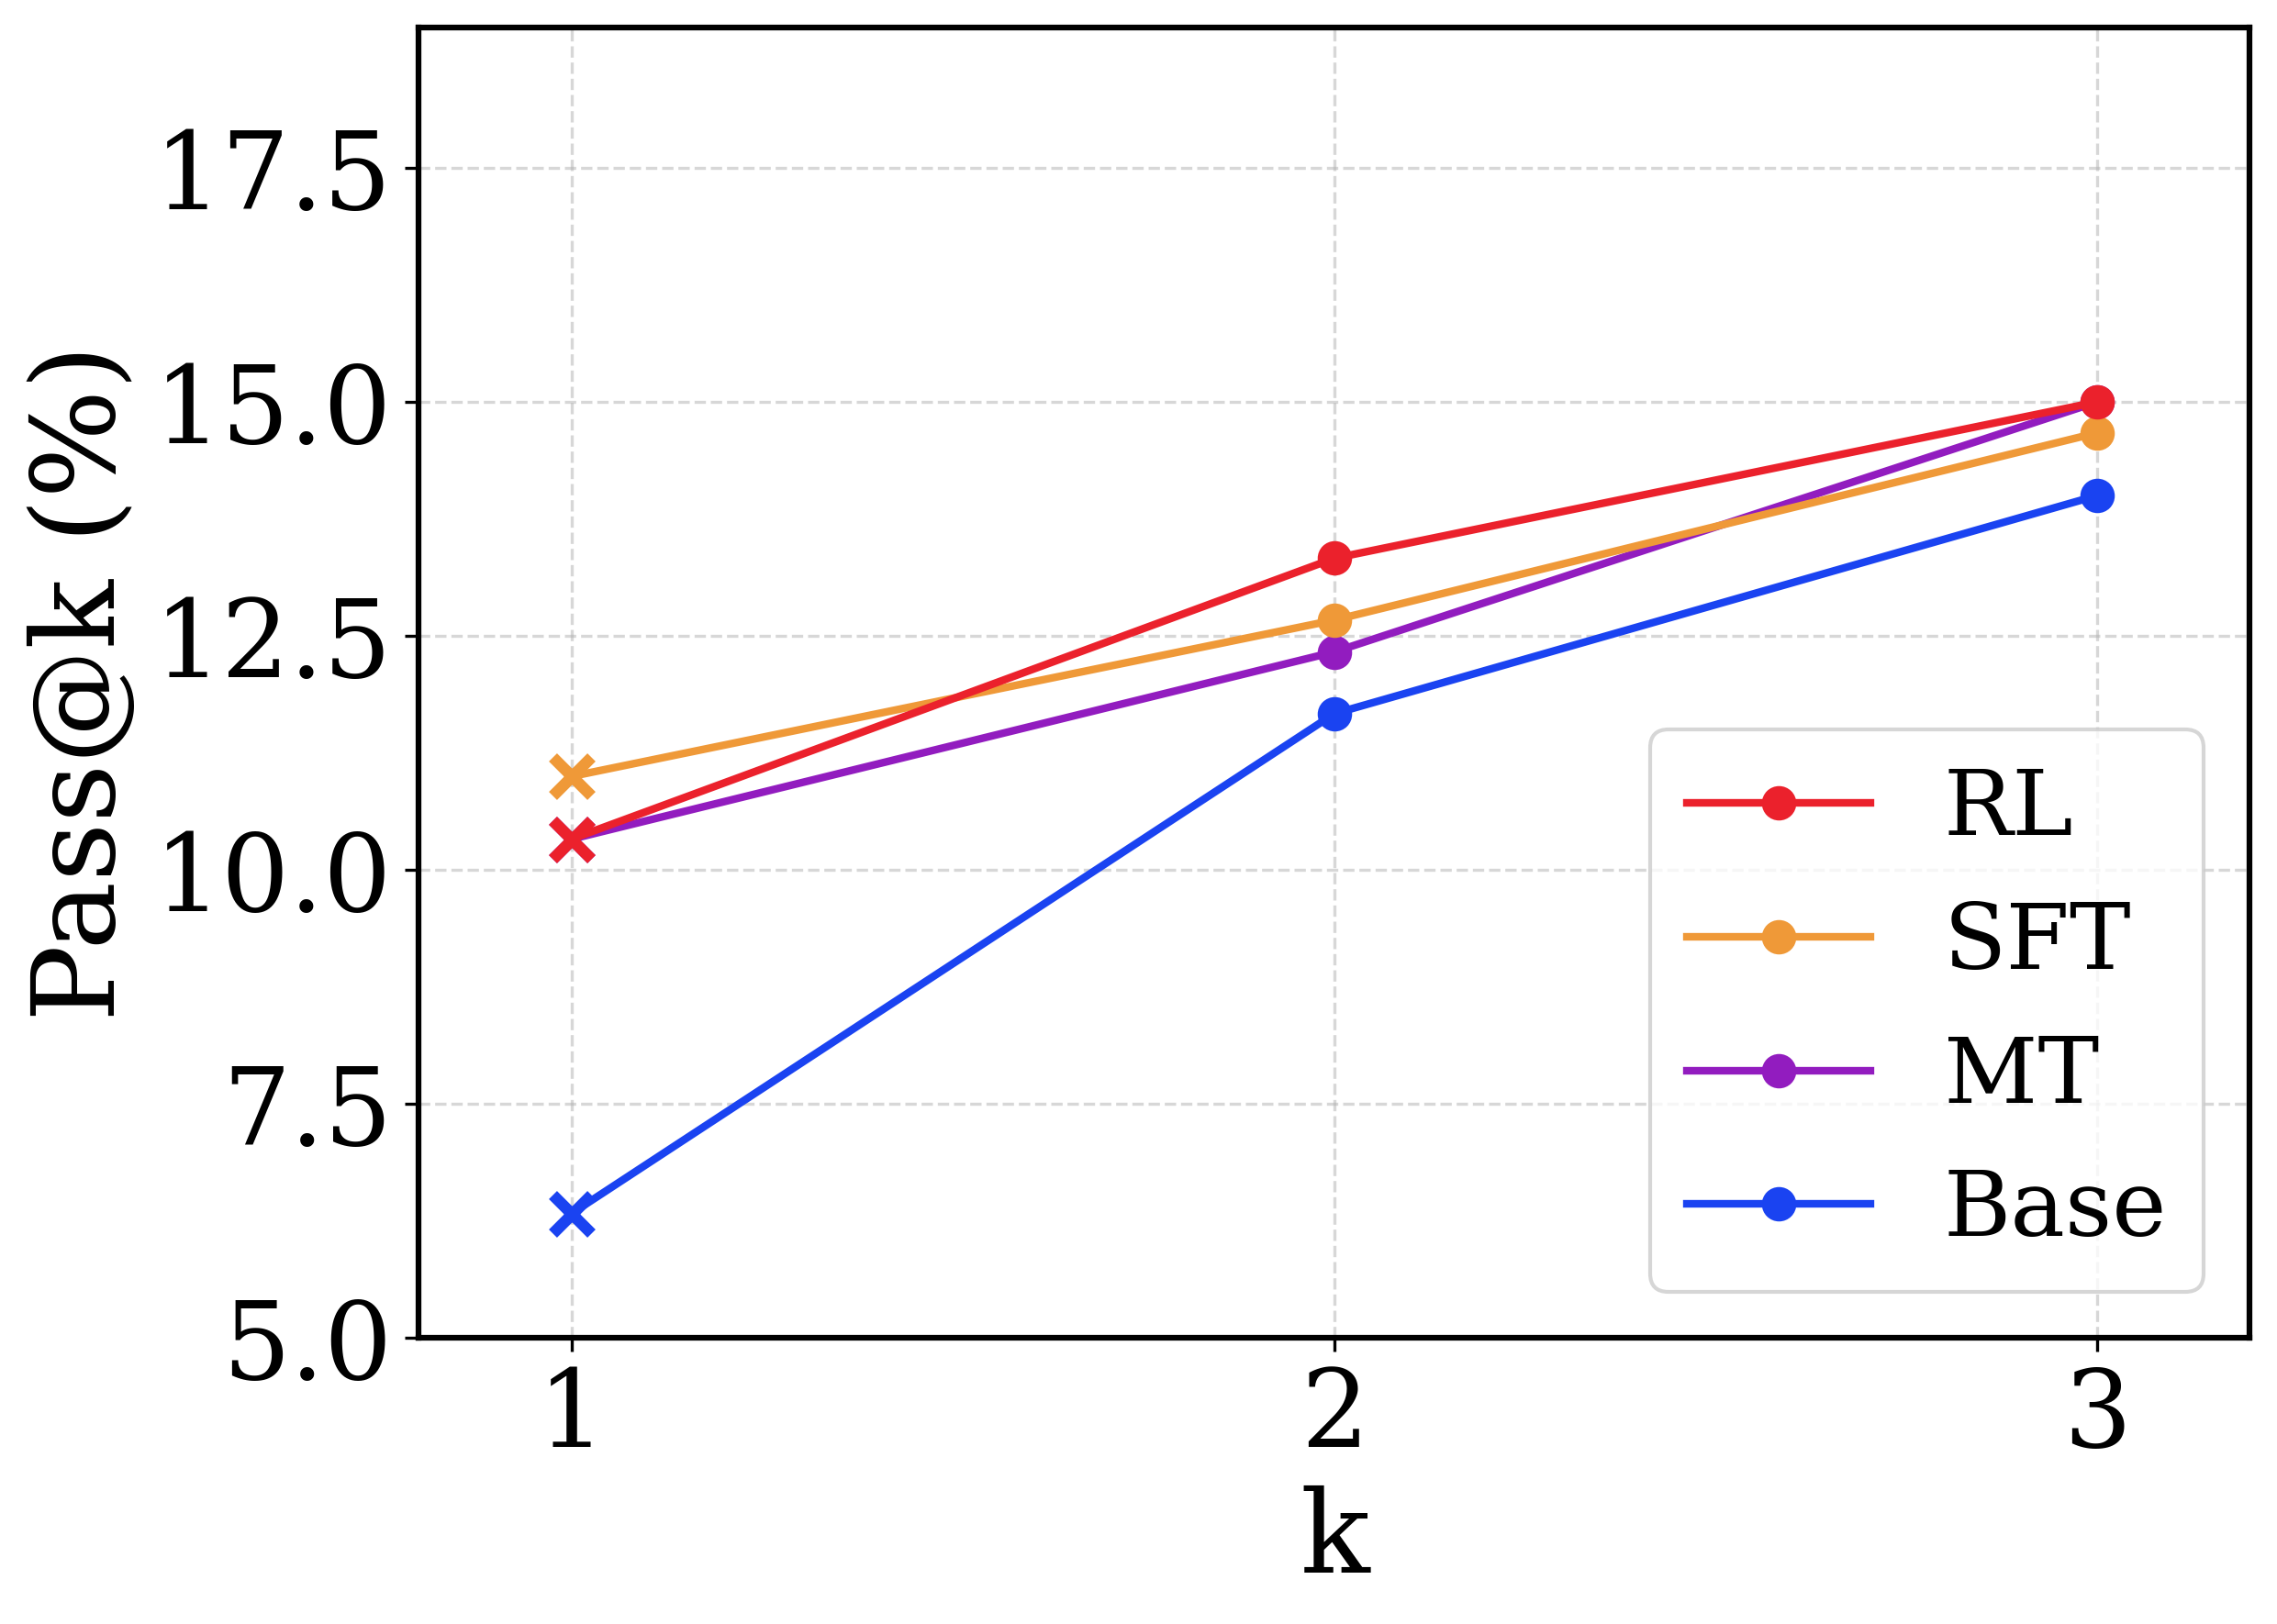
The image depicts a line chart titled **"Pass@k (%)"** with the following components:
### Axes
- **X-axis (Horizontal):** Labeled **"k"** with discrete values at **1, 2, 3**.
- **Y-axis (Vertical):** Labeled **"Pass@k (%)"** with a range from **5.0% to 17.5%**, marked in increments of **2.5%**.
### Legend
- Located in the **lower-right quadrant** of the chart.
- **Color-Coded Labels:**
- **Red (■):** RL
- **Orange (■):** SFT
- **Purple (■):** MT
- **Blue (■):** Base
### Data Series
#### 1. RL (Red Line)
- **Trend:** Steadily increasing from **k=1 to k=3**.
- **Data Points:**
- **k=1:** ~10.2%
- **k=2:** ~13.2%
- **k=3:** ~15.0%
#### 2. SFT (Orange Line)
- **Trend:** Gradual upward slope, slightly less steep than RL.
- **Data Points:**
- **k=1:** ~10.8%
- **k=2:** ~12.8%
- **k=3:** ~14.8%
#### 3. MT (Purple Line)
- **Trend:** Consistent increase, closely following RL.
- **Data Points:**
- **k=1:** ~10.1%
- **k=2:** ~12.1%
- **k=3:** ~14.9%
#### 4. Base (Blue Line)
- **Trend:** Sharp rise from **k=1 to k=2**, then a slower increase.
- **Data Points:**
- **k=1:** ~6.5%
- **k=2:** ~11.8%
- **k=3:** ~14.0%
### Spatial Grounding
- **Legend Position:** Lower-right quadrant (coordinates: x=0.85, y=0.15 relative to chart boundaries).
- **Data Point Markers:** All lines use **cross-shaped markers (×)** at each data point.
### Key Observations
1. **RL** achieves the highest Pass@k values across all k, peaking at **15.0%** for k=3.
2. **Base** starts significantly lower but surpasses SFT and MT by k=3.
3. All lines exhibit upward trends, indicating improved performance as k increases.
### Notes
- No textual annotations or additional legends are present.
- All data points align with the legend colors (e.g., red markers correspond to RL).
- No non-English text detected.
This extraction ensures full fidelity to the chart's structure, trends, and numerical data.