## Comparison Table: Model Performance on Knowledge Questions
### Overview
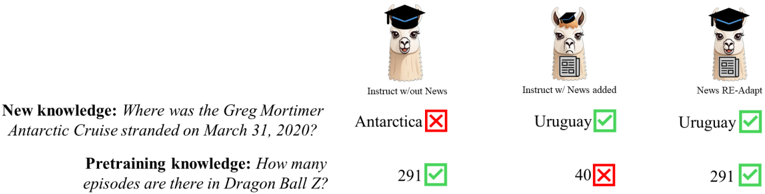
The image compares three AI models (Instruct w/out News, Instruct w/ News added, News RE-Adapt) across two knowledge questions:
1. **New Knowledge**: Location of the Greg Mortimer Antarctic Cruise stranding (March 31, 2020)
2. **Pretraining Knowledge**: Number of episodes in *Dragon Ball Z*
### Components/Axes
- **Models** (Columns):
1. Instruct w/out News (🦙 with graduation cap)
2. Instruct w/ News added (🦙 with newspaper)
3. News RE-Adapt (🦙 with graduation cap and newspaper)
- **Questions** (Rows):
- New Knowledge (top row)
- Pretraining Knowledge (bottom row)
- **Correctness Indicators**:
- ✅ Green checkmark (correct answer)
- ❌ Red X (incorrect answer)
### Detailed Analysis
#### New Knowledge Question
- **Instruct w/out News**: Answered "Antarctica" ❌ (incorrect)
- **Instruct w/ News added**: Answered "Uruguay" ✅ (correct)
- **News RE-Adapt**: Answered "Uruguay" ✅ (correct)
#### Pretraining Knowledge Question
- **Instruct w/out News**: Answered "291" ✅ (correct)
- **Instruct w/ News added**: Answered "40" ❌ (incorrect)
- **News RE-Adapt**: Answered "291" ✅ (correct)
### Key Observations
1. **New Knowledge**:
- Models with news integration (Instruct w/ News added, News RE-Adapt) correctly identified Uruguay as the stranding location.
- Instruct w/out News failed without news data.
2. **Pretraining Knowledge**:
- Instruct w/ News added showed a significant drop in pretraining knowledge (40 vs. 291), suggesting news integration may interfere with existing knowledge.
- News RE-Adapt maintained both new and pretraining knowledge accuracy.
### Interpretation
- **News Integration Trade-offs**:
Adding news improves factual recall for recent events (e.g., cruise location) but risks disrupting foundational knowledge (e.g., *Dragon Ball Z* episodes).
- **RE-Adapt Advantage**:
The News RE-Adapt model balances both tasks effectively, indicating a robust architecture for integrating external data without sacrificing pretrained knowledge.
- **Critical Insight**:
Model performance depends on task alignment with training data. News-enhanced models excel at novel factual queries but require careful tuning to preserve core competencies.
## Additional Notes
- **Language**: English (primary), with emoji symbols (🦙, ✅, ❌) used for visual emphasis.
- **Spatial Grounding**:
- Models are arranged left-to-right (Instruct w/out News → News RE-Adapt).
- Correctness indicators are aligned vertically with answers.
- **Trend Verification**:
- News RE-Adapt shows consistent performance across both tasks, unlike Instruct w/ News added, which exhibits a trade-off.