## Diagram: Target Localization Setup
### Overview
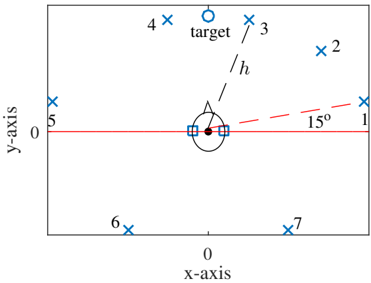
The image depicts a diagram illustrating a target localization setup. It shows a central figure (presumably a person) with a target and several points marked with 'x' symbols, numbered 1 through 7. The diagram includes coordinate axes and annotations indicating distances and angles.
### Components/Axes
* **Axes:**
* x-axis: Labeled "x-axis" and runs horizontally across the center of the diagram.
* y-axis: Labeled "y-axis" and runs vertically along the left edge of the diagram.
* **Central Figure:** A circular representation of a person's head, with two square markers on either side.
* **Target:** A small circle labeled "target" located above the central figure.
* **Points:** Seven points marked with blue 'x' symbols, numbered 1 through 7.
* **Distance:** A dashed line labeled "h" connects the central figure to the target.
* **Angle:** A dashed red line extending from the central figure to point 1, labeled "15°".
* **Zero Lines:** Red lines indicate the zero positions on both the x and y axes.
### Detailed Analysis
* **Point Locations:**
* Point 1: Located to the right of the central figure, at approximately y=0.
* Point 2: Located in the upper-right quadrant.
* Point 3: Located above and slightly to the right of the central figure.
* Point 4: Located above and to the left of the central figure.
* Point 5: Located to the left of the central figure, at approximately y=0.
* Point 6: Located in the lower-left quadrant.
* Point 7: Located in the lower-right quadrant.
* **Distance "h":** The dashed line "h" represents the distance between the central figure and the target.
* **Angle "15°":** The dashed red line indicates an angle of 15 degrees relative to the horizontal axis.
### Key Observations
* The diagram is symmetrical about the y-axis.
* Points 1 and 5 are located on the x-axis.
* Points 6 and 7 are located below the x-axis, while points 2, 3, and 4 are located above the x-axis.
### Interpretation
The diagram likely represents a setup for studying or simulating target localization. The central figure represents a listener or observer, the target is the sound source to be localized, and the points represent potential locations of other sound sources or measurement points. The distance "h" and angle "15°" are parameters used to define the spatial relationships between the listener, the target, and other elements in the environment. The diagram could be used to analyze the accuracy and precision of different localization algorithms or to investigate the effects of noise and reverberation on localization performance.