## Flowchart: GPU Workload Analysis and Fault Injection Process
### Overview
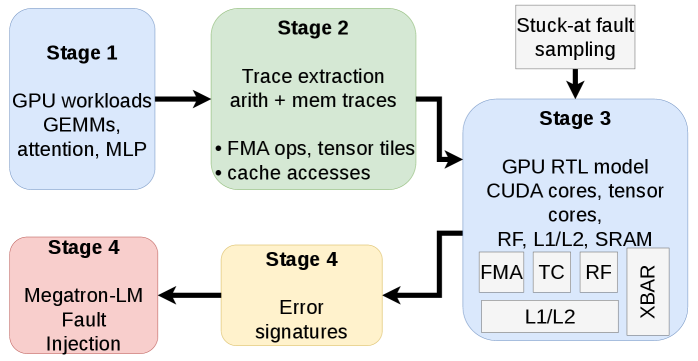
The flowchart illustrates a four-stage process for analyzing GPU workloads and injecting faults to study error signatures. It begins with GPU workloads, progresses through trace extraction and modeling, and concludes with fault injection and error signature analysis. Arrows indicate sequential dependencies between stages.
### Components/Axes
- **Stages**:
- **Stage 1** (Blue): GPU workloads (GEMMs, attention, MLP)
- **Stage 2** (Green): Trace extraction (arithmetic + memory traces, FMA operations, tensor tiles, cache accesses)
- **Stage 3** (Blue): GPU RTL model (CUDA cores, tensor cores, RF, L1/L2, SRAM) and stuck-at fault sampling
- **Stage 4** (Pink/Yellow): Megatron-LM fault injection and error signatures
- **Arrows**: Represent data flow between stages (e.g., Stage 1 → Stage 2 → Stage 3 → Stage 4).
- **Text Labels**: Explicitly describe processes (e.g., "FMA ops," "cache accesses," "stuck-at fault sampling").
### Detailed Analysis
1. **Stage 1 (Blue)**:
- Focuses on GPU workloads, including matrix multiplications (GEMMs), attention mechanisms, and multilayer perceptrons (MLP).
- Positioned at the top-left, serving as the input to subsequent stages.
2. **Stage 2 (Green)**:
- Extracts traces from Stage 1 workloads, including arithmetic operations, memory accesses, FMA operations, tensor tiles, and cache accesses.
- Positioned centrally, acting as an intermediary between workload analysis and modeling.
3. **Stage 3 (Blue)**:
- Models GPU architecture using RTL (Register Transfer Level) simulations, including CUDA cores, tensor cores, and memory hierarchies (RF, L1/L2, SRAM).
- Integrates "stuck-at fault sampling" to simulate hardware faults.
- Positioned to the right of Stage 2, receiving trace data for modeling.
4. **Stage 4 (Pink/Yellow)**:
- **Megatron-LM Fault Injection**: Introduces faults into the Megatron-LM framework (a large language model).
- **Error Signatures**: Captures the resulting errors from fault injection.
- Positioned at the bottom, receiving input from Stage 3 modeling.
### Key Observations
- **Sequential Dependency**: Each stage feeds into the next, forming a linear pipeline from workload analysis to fault injection.
- **Color Coding**: Stages are differentiated by color (blue, green, pink/yellow), but no explicit legend is present.
- **Fault Injection Focus**: Stage 4 emphasizes error analysis, suggesting the flowchart’s purpose is to study hardware/software interactions under fault conditions.
### Interpretation
This flowchart outlines a methodology for debugging or optimizing GPU performance by:
1. Profiling workloads (Stage 1),
2. Extracting detailed traces (Stage 2),
3. Simulating hardware behavior (Stage 3), and
4. Injecting faults to identify error patterns (Stage 4).
The integration of "stuck-at fault sampling" in Stage 3 implies a focus on hardware reliability, while the use of Megatron-LM in Stage 4 highlights applications in AI/ML systems. The absence of a legend suggests the color coding is purely visual, not data-driven. The process could be used to validate fault-tolerant designs or improve error resilience in GPU-accelerated workloads.