## Chart: Model Performance vs. Annotation Cost
### Overview
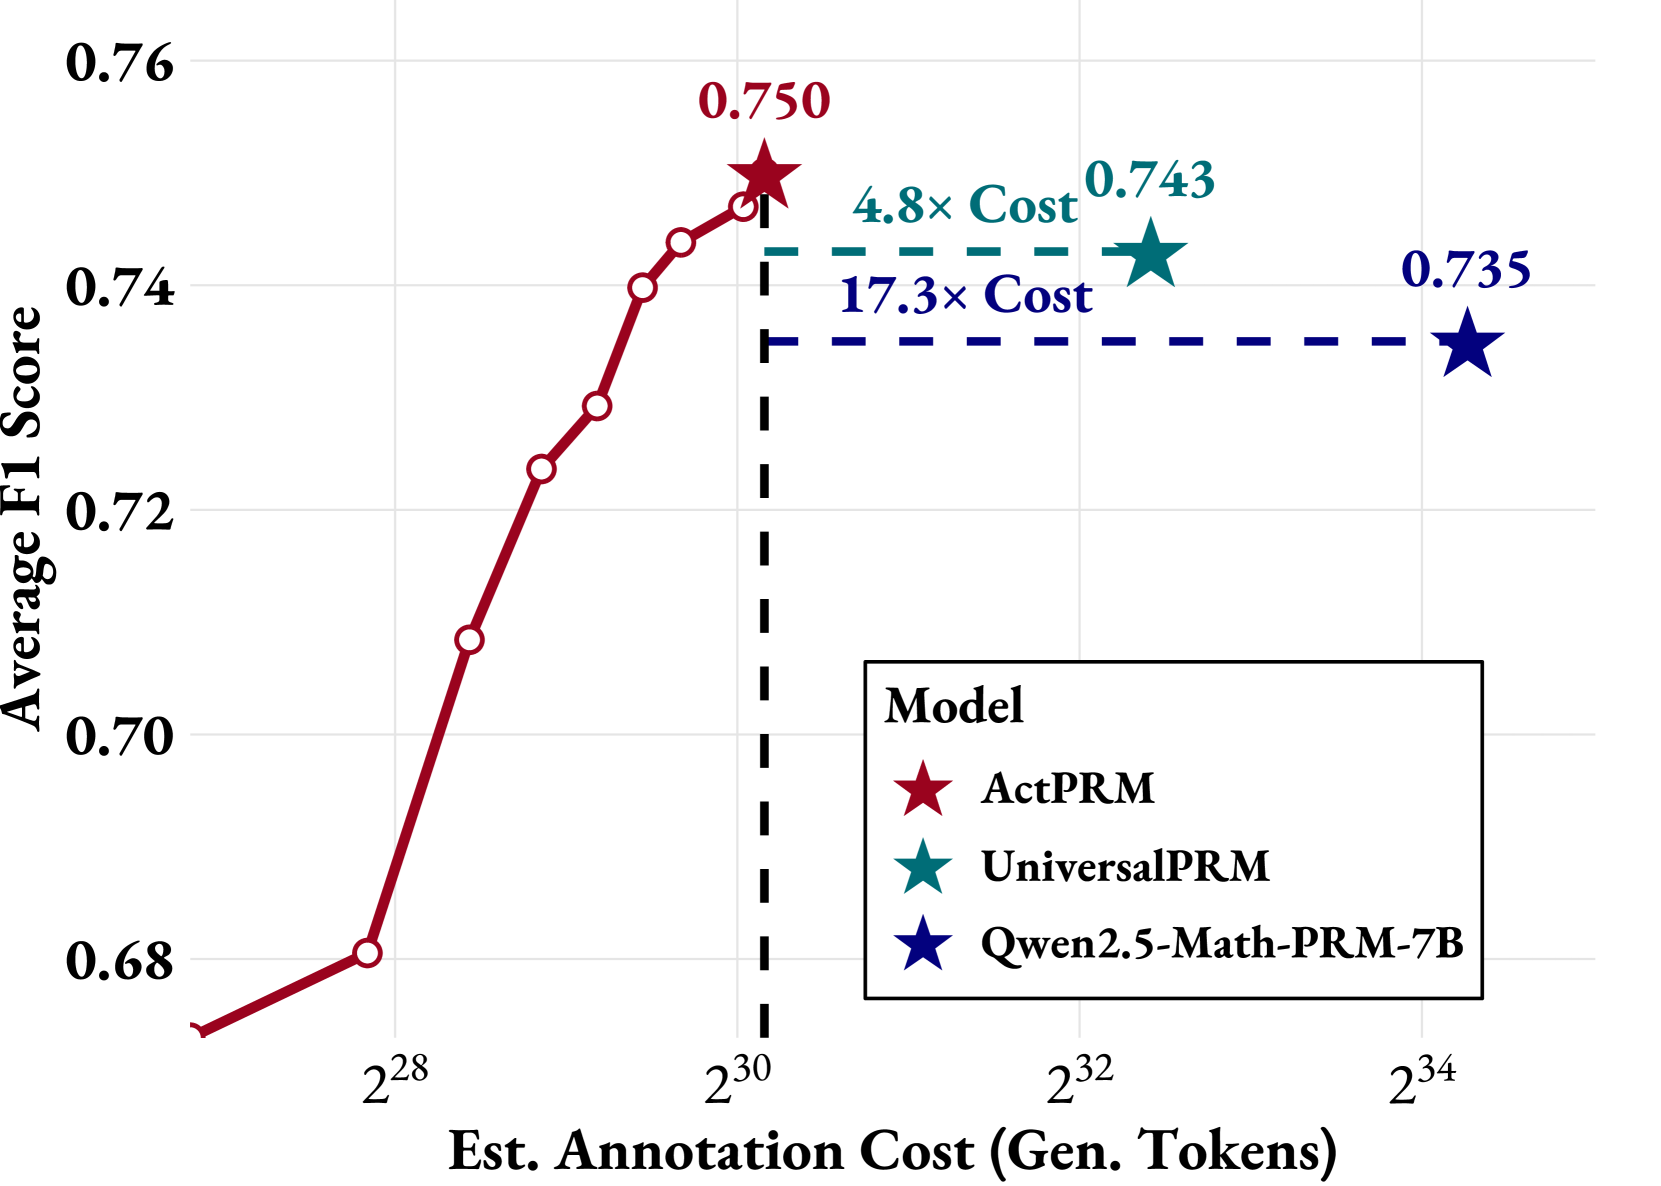
The image is a chart comparing the performance (Average F1 Score) of three different models (ActPRM, UniversalPRM, and Qwen2.5-Math-PRM-7B) against their estimated annotation cost (in generated tokens). The chart shows how the F1 score increases with the annotation cost for ActPRM, and then compares the F1 scores of the other two models at specific annotation cost levels relative to ActPRM.
### Components/Axes
* **X-axis:** Est. Annotation Cost (Gen. Tokens). The scale is logarithmic, with markers at 2<sup>28</sup>, 2<sup>30</sup>, 2<sup>32</sup>, and 2<sup>34</sup>.
* **Y-axis:** Average F1 Score. The scale ranges from 0.68 to 0.76, with markers at 0.68, 0.70, 0.72, 0.74, and 0.76.
* **Legend (bottom-right):**
* Red Star: ActPRM
* Teal Star: UniversalPRM
* Dark Blue Star: Qwen2.5-Math-PRM-7B
### Detailed Analysis
* **ActPRM (Red Line):** The red line shows the performance of the ActPRM model as the annotation cost increases.
* At approximately 2<sup>28</sup> tokens, the F1 score is around 0.68.
* The line slopes upward, reaching an F1 score of 0.750 at 2<sup>30</sup> tokens.
* A dashed vertical line extends downward from the ActPRM data point at 2<sup>30</sup>.
* **UniversalPRM (Teal Star):** The UniversalPRM model has an F1 score of 0.743.
* The annotation cost for UniversalPRM is 4.8x the cost of ActPRM at 2<sup>30</sup> tokens.
* The x-axis value for UniversalPRM is approximately 2<sup>32</sup>.
* **Qwen2.5-Math-PRM-7B (Dark Blue Star):** The Qwen2.5-Math-PRM-7B model has an F1 score of 0.735.
* The annotation cost for Qwen2.5-Math-PRM-7B is 17.3x the cost of ActPRM at 2<sup>30</sup> tokens.
* The x-axis value for Qwen2.5-Math-PRM-7B is approximately 2<sup>34</sup>.
### Key Observations
* The ActPRM model's performance increases significantly as the annotation cost increases from 2<sup>28</sup> to 2<sup>30</sup> tokens.
* UniversalPRM and Qwen2.5-Math-PRM-7B achieve lower F1 scores than ActPRM at 2<sup>30</sup>, but at significantly higher annotation costs.
* The annotation cost increases exponentially for UniversalPRM and Qwen2.5-Math-PRM-7B compared to ActPRM.
### Interpretation
The chart suggests that while ActPRM's performance initially increases with annotation cost, there are diminishing returns. UniversalPRM and Qwen2.5-Math-PRM-7B achieve lower F1 scores than ActPRM at 2<sup>30</sup>, but at significantly higher annotation costs. This indicates that ActPRM is more efficient in terms of performance per annotation cost, at least up to the 2<sup>30</sup> token mark. The 4.8x and 17.3x cost multipliers highlight the trade-offs between model complexity, annotation effort, and performance. The data implies that a simpler model with targeted annotation might be more effective than a more complex model requiring extensive annotation.