## Line Chart: Average F1 Score vs. Estimated Annotation Cost
### Overview
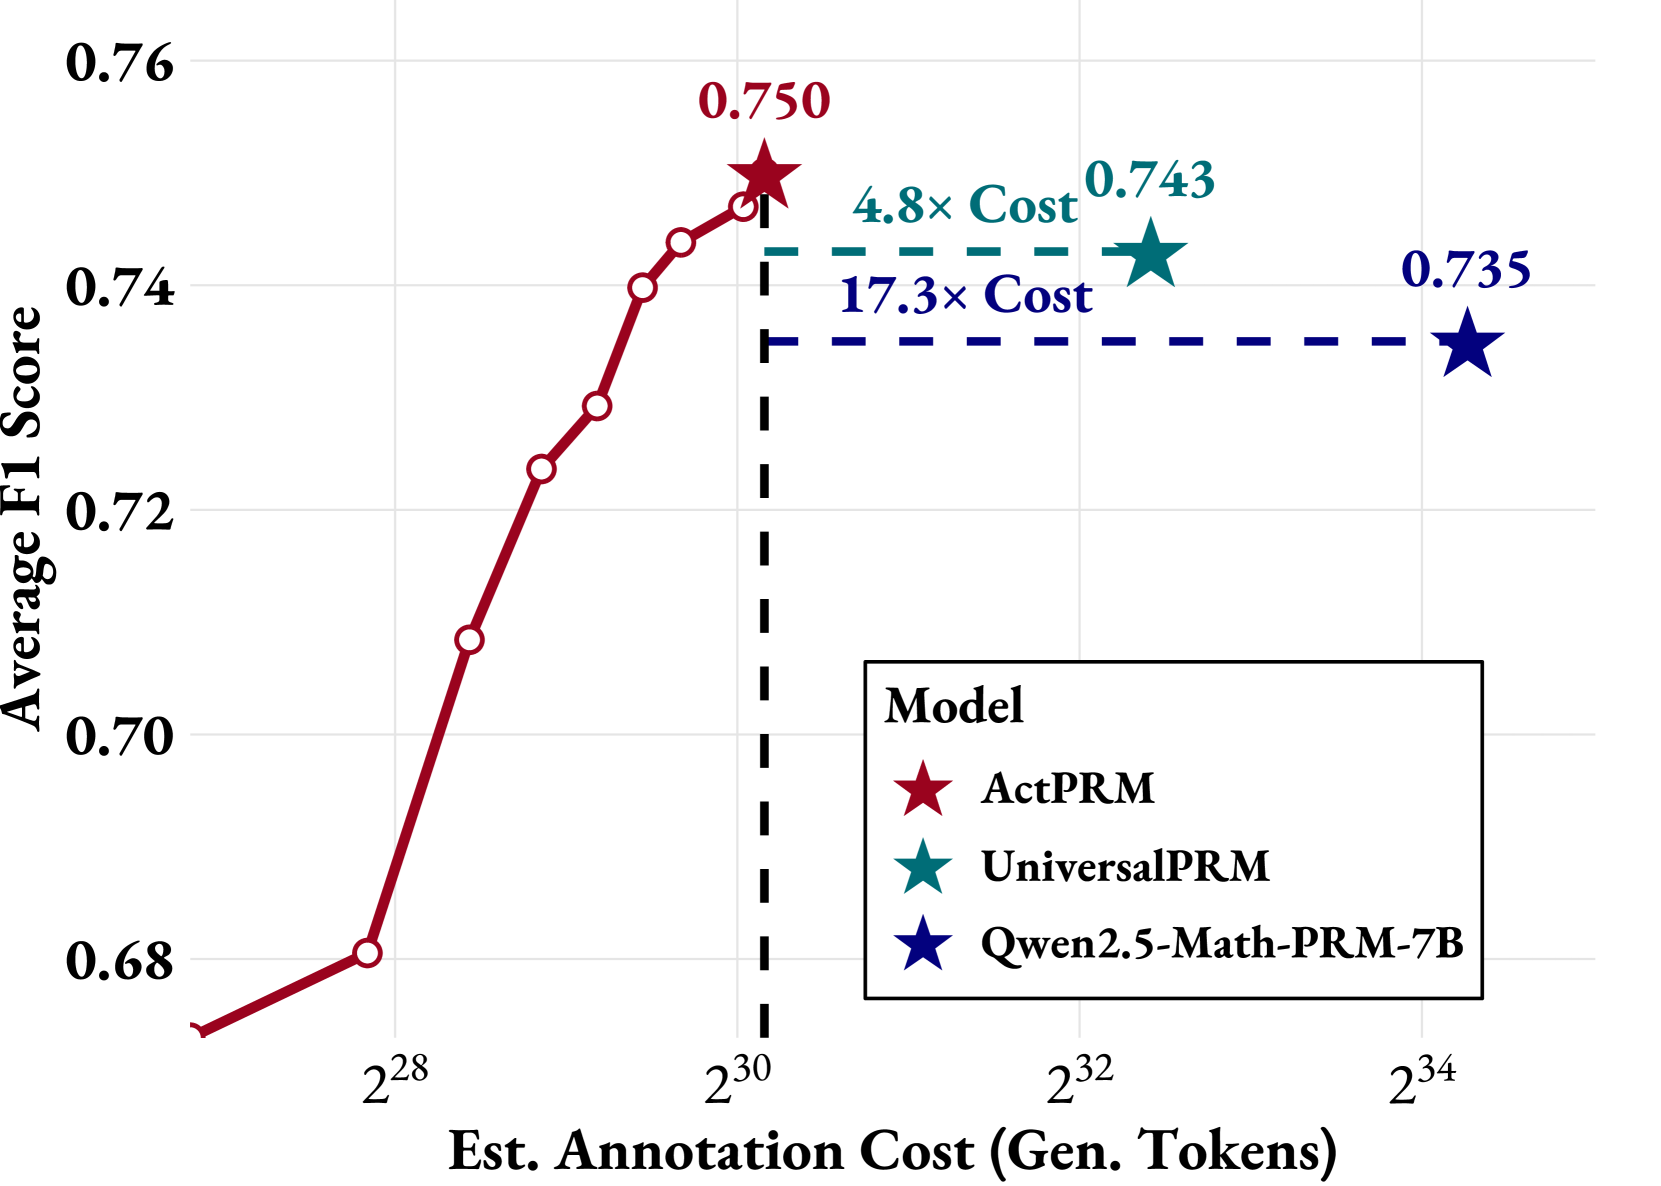
The chart compares the performance (Average F1 Score) of three language models (ActPRM, UniversalPRM, Qwen2.5-Math-PRM-7B) against their estimated annotation costs (in generated tokens). Performance improves with higher annotation costs, but trade-offs exist between cost and efficiency.
### Components/Axes
- **X-axis**: "Est. Annotation Cost (Gen. Tokens)" (logarithmic scale: 2²⁸ to 2³⁴)
- **Y-axis**: "Average F1 Score" (linear scale: 0.68 to 0.76)
- **Legend**: Located in the bottom-right corner, mapping colors to models:
- Red star: ActPRM
- Teal star: UniversalPRM
- Blue star: Qwen2.5-Math-PRM-7B
- **Annotations**:
- Red line (ActPRM) peaks at 0.750 (2³⁰ tokens)
- Teal line (UniversalPRM) at 0.743 (2³² tokens)
- Blue line (Qwen2.5) at 0.735 (2³⁴ tokens)
- Dashed lines indicate cost multipliers: "4.8× Cost" (2³⁰) and "17.3× Cost" (2³²)
### Detailed Analysis
1. **ActPRM (Red Line)**:
- Starts at 0.68 (2²⁸ tokens) and rises sharply to 0.750 (2³⁰ tokens).
- Shows the steepest improvement in F1 score per token.
- Annotated with a star at its peak (0.750).
2. **UniversalPRM (Teal Line)**:
- Flat line at 0.743, positioned at 2³² tokens.
- Cost multiplier: 4.8× higher than ActPRM’s baseline (2³⁰ vs. 2³²).
3. **Qwen2.5-Math-PRM-7B (Blue Line)**:
- Flat line at 0.735, positioned at 2³⁴ tokens.
- Cost multiplier: 17.3× higher than ActPRM’s baseline (2³⁴ vs. 2³⁰).
### Key Observations
- **ActPRM** achieves the highest F1 score (0.750) at the lowest cost (2³⁰ tokens), outperforming others in efficiency.
- **UniversalPRM** and **Qwen2.5** have lower F1 scores (0.743 and 0.735, respectively) but require significantly higher annotation costs (4.8× and 17.3× more tokens than ActPRM).
- All models plateau after their respective cost thresholds, suggesting diminishing returns beyond certain annotation budgets.
### Interpretation
- **Cost-Effectiveness**: ActPRM offers the best balance of performance and cost, making it the most efficient model for annotation tasks.
- **Trade-offs**: UniversalPRM and Qwen2.5 sacrifice cost efficiency for marginally lower performance gains, which may not justify their higher resource demands.
- **Diminishing Returns**: The flat lines for UniversalPRM and Qwen2.5 imply that increasing annotation costs beyond 2³² and 2³⁴ tokens yields no further F1 score improvements, highlighting potential inefficiencies in scaling.
- **Strategic Implications**: Organizations prioritizing cost savings should favor ActPRM, while those requiring absolute maximum performance might consider the trade-offs of UniversalPRM or Qwen2.5 despite their higher costs.