# Technical Document Analysis: Feedback Loop Diagram
## Diagram Components
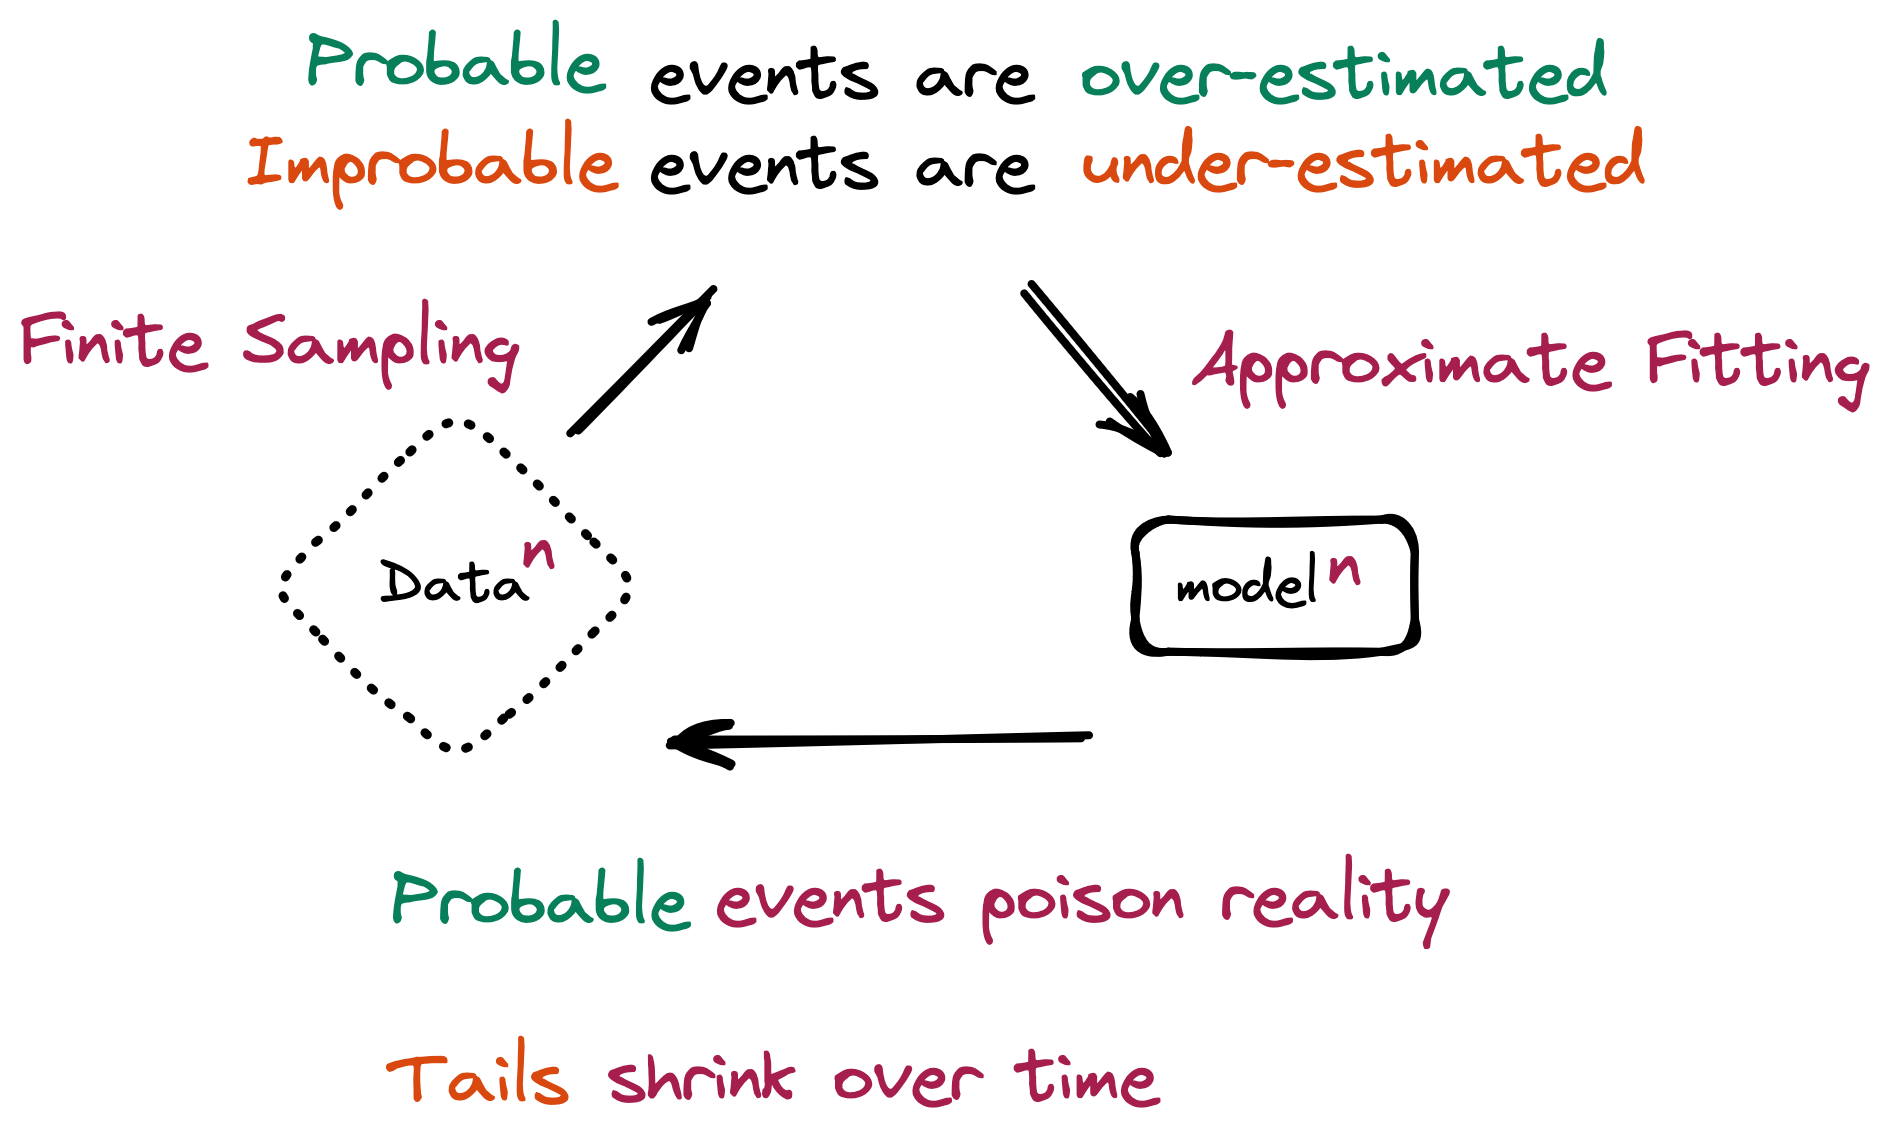
1. **Central Elements**
- **Diamond Shape**: Labeled "Data" with superscript "n" (⬛)
- **Rectangle**: Labeled "model" with superscript "n" (⬛)
2. **Connecting Arrows**
- **Bidirectional Flow**: Black arrows between "Data" and "model" indicating cyclical relationship
- **Directionality**:
- Left arrow: "Data" → "model"
- Right arrow: "model" → "Data"
## Textual Annotations
### Header Section
- **Probability Estimation Errors**
- Green text: "Probable events are over-estimated"
- Orange text: "Improbable events are under-estimated"
### Left Side
- **Process Label**: "Finite Sampling" (purple text)
### Right Side
- **Process Label**: "Approximate Fitting" (purple text)
### Footer Section
- **Systemic Consequences**
- Green text: "Probable events poison reality"
- Orange text: "Tails shrink over time"
## Spatial Relationships
1. **Data-Model Interaction**
- Diamond (Data) positioned left of rectangle (model)
- Arrows create closed loop between elements
2. **Text Placement**
- Header text centered above diagram
- Process labels aligned with respective process arrows
- Consequence text centered below diagram
## System Dynamics
1. **Feedback Mechanism**
- Data informs model through finite sampling
- Model refines understanding via approximate fitting
- Cyclical process creates self-reinforcing loop
2. **Critical Observations**
- Probability estimation biases:
- Overestimation of probable events
- Underestimation of improbable events
- Reality distortion: Probable events "poison" reality
- Temporal effect: Tails (likely referring to statistical distributions) shrink over time
## Color Coding
- **Green**: Probability-related observations
- **Orange**: Estimation error patterns
- **Purple**: Process descriptions
- **Black**: Structural elements (shapes, arrows)
## System Implications
The diagram illustrates a self-reinforcing cycle where:
1. Limited data sampling leads to approximate model fitting
2. Model outputs influence subsequent data collection
3. Probability estimation errors compound over iterations
4. Systemic consequences emerge through reality distortion and distribution changes
This feedback loop suggests potential for escalating estimation errors and reality misalignment in systems relying on iterative data-model interactions.