## Diagram: Neural Network Model to System Memory Mapping
### Overview
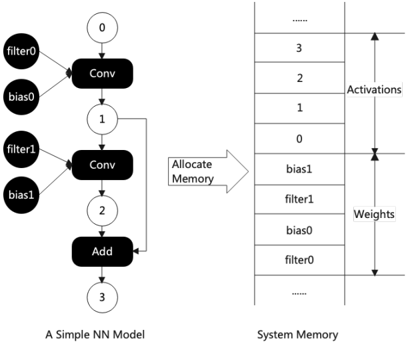
The image is a technical diagram illustrating the conceptual mapping of a simple neural network (NN) model's components to their corresponding locations in system memory. It is divided into two primary sections: a computational graph on the left and a memory layout on the right, connected by an arrow labeled "Allocate Memory."
### Components/Axes
**Left Section: A Simple NN Model**
* **Title:** "A Simple NN Model" (located at the bottom center of the left section).
* **Structure:** A directed acyclic graph (DAG) representing a sequential data flow.
* **Nodes (Operations):**
* `Conv` (Convolutional layer) - Appears twice.
* `Add` (Addition operation) - Appears once.
* **Data/Parameter Nodes (Inputs to Operations):**
* `filter0`, `bias0` (Inputs to the first `Conv` node).
* `filter1`, `bias1` (Inputs to the second `Conv` node).
* **Intermediate Data Nodes (Outputs/Activations):**
* Numbered circles: `0`, `1`, `2`, `3`.
* `0` is the input to the first `Conv`.
* `1` is the output of the first `Conv` and input to the second `Conv`.
* `2` is the output of the second `Conv` and one input to the `Add` node.
* `3` is the output of the `Add` node (final output).
* **Flow Direction:** Top-to-bottom, indicated by arrows connecting the nodes.
**Right Section: System Memory**
* **Title:** "System Memory" (located at the bottom center of the right section).
* **Structure:** A vertical stack representing a linear memory address space.
* **Memory Segments (from top to bottom):**
* A section labeled **"Activations"** (indicated by a vertical double-headed arrow spanning this region).
* Contains memory slots labeled with numbers: `3`, `2`, `1`, `0` (from top to bottom).
* A section labeled **"Weights"** (indicated by a vertical double-headed arrow spanning this region).
* Contains memory slots labeled with parameter names: `bias1`, `filter1`, `bias0`, `filter0` (from top to bottom).
* Ellipsis (`...`) at the very top and bottom, indicating the memory space extends beyond the shown portion.
**Connecting Element:**
* A large arrow points from the left diagram to the right diagram.
* Text on the arrow: "Allocate Memory".
### Detailed Analysis
The diagram establishes a direct correspondence between the logical components of the NN model and their physical storage in system memory.
1. **Activation Mapping:** The intermediate data nodes (`0`, `1`, `2`, `3`) from the model graph are stored in the "Activations" region of memory. Their order in memory (from address `0` at the bottom to `3` at the top) corresponds to their sequence in the computational graph, but in reverse spatial order (the first activation `0` is at the lowest address shown).
2. **Weight Mapping:** The model's parameters (`filter0`, `bias0`, `filter1`, `bias1`) are stored contiguously in the "Weights" region. Their order in memory (from `filter0` at the bottom to `bias1` at the top) does not follow the order of their use in the graph. `filter0` and `bias0` (used first) are at lower addresses than `filter1` and `bias1` (used second).
3. **Data Flow vs. Memory Layout:** The diagram highlights that the sequential data flow in the model (0 → Conv → 1 → Conv → 2 → Add → 3) does not translate to a simple sequential layout in memory. Activations and weights are stored in separate, dedicated regions.
### Key Observations
* **Conceptual Abstraction:** The diagram is a high-level schematic. It does not show actual memory addresses, data sizes, or data types.
* **Separation of Concerns:** It clearly distinguishes between volatile intermediate data (Activations) and persistent model parameters (Weights).
* **Non-Sequential Weight Storage:** The weights are not stored in the order they are consumed by the network layers. This is a common practice in memory management for efficiency or hardware alignment reasons.
* **Activation Reuse Implication:** The `Add` operation takes two inputs (`1` and `2`). The diagram shows both `1` and `2` stored in the Activations memory, implying they must be retained until the `Add` operation is performed.
### Interpretation
This diagram serves as an educational or architectural visualization for understanding how a neural network's computational graph is materialized in hardware memory. It demonstrates the fundamental principle of **memory allocation for deep learning inference or training**.
* **What it suggests:** The process of running a neural network involves two key memory management tasks: allocating space for the network's fixed parameters (Weights) and dynamically allocating space for the intermediate results (Activations) generated during the forward pass.
* **Relationship between elements:** The "Allocate Memory" arrow signifies the critical step where the abstract model definition is bound to concrete system resources. The model defines *what* to compute, and the memory layout defines *where* the data lives during computation.
* **Notable insight:** The diagram subtly hints at optimization opportunities. For instance, the memory for activation `0` might be reused for activation `2` after the first convolution is complete, a technique known as **memory planning or buffer reuse**, which is essential for running large models on devices with limited memory. The separate, contiguous block for weights also facilitates efficient loading from storage (e.g., from disk to RAM) or transfer to specialized hardware (e.g., a GPU's VRAM).