## Scatter Plot Matrix: SFC vs. CFC Evolution Over Time
### Overview
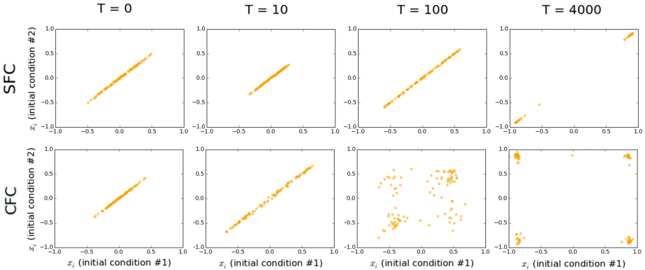
The image presents a 2x4 matrix of scatter plots, comparing the evolution of two conditions, SFC and CFC, over time (T = 0, 10, 100, 4000). Each plot shows the relationship between two initial conditions, labeled as #1 and #2, with the x-axis representing condition #1 and the y-axis representing condition #2. The plots illustrate how the distribution of data points changes over time for each condition.
### Components/Axes
* **Rows:**
* Top Row: SFC (initial condition #2)
* Bottom Row: CFC (initial condition #2)
* **Columns:**
* Column 1: T = 0
* Column 2: T = 10
* Column 3: T = 100
* Column 4: T = 4000
* **Axes:**
* X-axis (horizontal): *x<sub>i</sub>* (initial condition #1). Scale ranges from -1.0 to 1.0, with tick marks at -1.0, -0.5, 0.0, 0.5, and 1.0.
* Y-axis (vertical): *x<sub>i</sub>* (initial condition #2). Scale ranges from -1.0 to 1.0, with tick marks at -1.0, -0.5, 0.0, 0.5, and 1.0.
* **Data Points:** Each plot contains multiple orange data points.
### Detailed Analysis
**SFC (Top Row):**
* **T = 0:** Data points form a relatively tight, positively sloped linear cluster.
* **T = 10:** The cluster remains linear and positively sloped, but the points are slightly more dispersed than at T = 0.
* **T = 100:** The linear relationship weakens, and the points become more scattered.
* **T = 4000:** The points are concentrated in the corners of the plot, forming four distinct clusters.
**CFC (Bottom Row):**
* **T = 0:** Similar to SFC at T = 0, the data points form a tight, positively sloped linear cluster.
* **T = 10:** The cluster remains linear and positively sloped, with a slight increase in dispersion compared to T = 0.
* **T = 100:** The points are significantly more scattered, forming a complex, non-linear pattern.
* **T = 4000:** The points are concentrated near the edges and corners of the plot, forming a more defined square-like shape with clusters in the corners.
### Key Observations
* Both SFC and CFC start with a strong positive correlation between initial conditions #1 and #2.
* As time progresses, the correlation weakens, and the data points become more dispersed.
* At T = 4000, both conditions exhibit clustering behavior, but the patterns are different. SFC clusters primarily in the corners, while CFC forms a more distributed pattern along the edges and corners.
### Interpretation
The plots illustrate the evolution of two systems (SFC and CFC) from an initial state of positive correlation to more complex and potentially chaotic states over time. The differences in the final distributions at T = 4000 suggest that the two systems evolve differently, possibly due to different underlying dynamics or parameters. The initial linear relationship indicates a strong dependency between the two initial conditions, which diminishes as the systems evolve independently. The clustering at later times suggests the emergence of stable states or attractors within the systems' phase space. The data suggests that while both systems start similarly, they diverge significantly over time, indicating different long-term behaviors.