## Network Node Diagram
### Overview
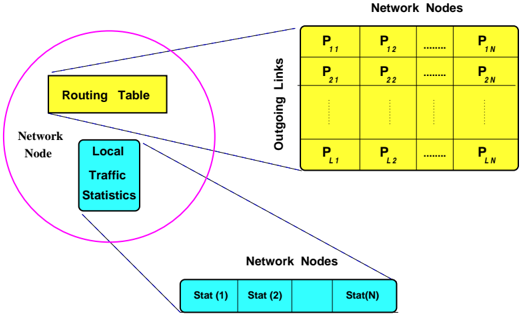
The image is a diagram illustrating the components and data associated with a network node. It shows a network node containing a routing table and local traffic statistics, along with representations of outgoing links and network node statistics.
### Components/Axes
* **Network Node:** Represented by a purple circle, containing:
* **Routing Table:** A yellow rectangle labeled "Routing Table".
* **Local Traffic Statistics:** A cyan rectangle labeled "Local Traffic Statistics".
* **Outgoing Links:** Represented by a yellow matrix.
* **Rows:** Correspond to network nodes, labeled P\_11, P\_21, ... P\_L1.
* **Columns:** Correspond to network nodes, labeled P\_12, P\_22, ... P\_L2, ... P\_1N, P\_2N, ... P\_LN.
* **Network Nodes:** Represented by a cyan horizontal array.
* **Elements:** Labeled Stat(1), Stat(2), ..., Stat(N).
### Detailed Analysis or ### Content Details
* **Routing Table:** A yellow rectangle.
* **Local Traffic Statistics:** A cyan rectangle.
* **Outgoing Links Matrix:**
* The matrix is yellow.
* The matrix elements are labeled P\_ij, where i represents the row number (1 to L) and j represents the column number (1 to N).
* The matrix represents the probabilities or some other metric associated with outgoing links from the network node to other network nodes.
* **Network Nodes Statistics:**
* The statistics are represented by cyan rectangles.
* Each rectangle is labeled Stat(i), where i ranges from 1 to N.
* These statistics likely represent some performance metric or state information for each of the N network nodes.
### Key Observations
* The diagram provides a high-level overview of the data structures and information associated with a network node in a network.
* The outgoing links are represented as a matrix, suggesting a connection probability or weight between the current node and other nodes in the network.
* The network node statistics provide information about the state or performance of other nodes in the network.
### Interpretation
The diagram illustrates the internal structure and external connections of a network node. The routing table and local traffic statistics represent the node's internal state, while the outgoing links matrix and network node statistics represent the node's interactions with the rest of the network. The matrix representation of outgoing links suggests that the network node maintains information about the connectivity and characteristics of its neighboring nodes. The network node statistics provide a broader view of the network's overall state, allowing the node to make informed routing decisions and adapt to changing network conditions.