\n
## Diagram: Network Node Components and Connections
### Overview
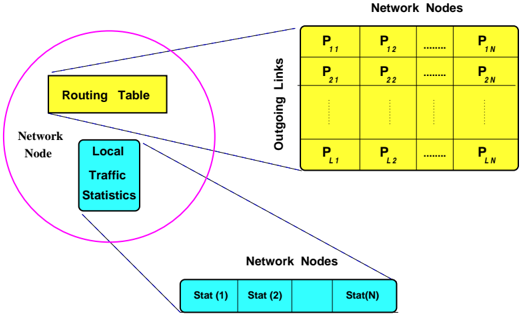
The image is a diagram illustrating the components within a network node and its connections to other network nodes. It depicts a network node containing a Routing Table and Local Traffic Statistics, and how these relate to outgoing links to other network nodes, each of which also maintains statistics. The diagram uses color-coding to differentiate components and connections.
### Components/Axes
The diagram consists of the following labeled components:
* **Network Node:** (Left side, enclosed in a pink circle) Represents a single node within the network.
* **Routing Table:** (Inside the Network Node, yellow rectangle) A component responsible for routing information.
* **Local Traffic Statistics:** (Inside the Network Node, blue rectangle) A component tracking local traffic data.
* **Outgoing Links:** (Right side, vertical label) Represents the connections from the network node to other nodes.
* **Network Nodes:** (Bottom, cyan rectangles) Represents the destination nodes.
* **Stat (1), Stat (2), ... Stat (N):** (Bottom, inside cyan rectangles) Represents the statistics maintained by each destination network node.
* **P<sub>11</sub>, P<sub>12</sub>, ... P<sub>1N</sub>, P<sub>21</sub>, P<sub>22</sub>, ... P<sub>2N</sub>, ... P<sub>L1</sub>, P<sub>L2</sub>, ... P<sub>LN</sub>:** (Right side, inside yellow grid) Represents the connection parameters between the source node and destination nodes.
### Detailed Analysis or Content Details
The diagram shows a network node with two internal components: a Routing Table and Local Traffic Statistics. The Routing Table is connected to a grid of outgoing links, labeled with parameters P<sub>ij</sub>, where 'i' likely represents the source node and 'j' the destination node. The grid has 'L' rows and 'N' columns, indicating a network with 'L' source nodes and 'N' destination nodes.
Each destination network node maintains statistics, labeled Stat(1) through Stat(N). The diagram suggests a one-to-many relationship, where a single network node connects to multiple destination nodes.
### Key Observations
* The diagram focuses on the internal workings of a network node and its connections to other nodes.
* The use of parameters P<sub>ij</sub> suggests a matrix-like representation of network connections.
* The presence of "Local Traffic Statistics" indicates that the network node monitors its own traffic.
* The diagram does not provide specific numerical values for the parameters or statistics. It is a conceptual representation.
### Interpretation
The diagram illustrates a simplified model of a network node's role in routing and traffic management. The Routing Table likely contains information about the best paths to reach different destination nodes. The Local Traffic Statistics are used to monitor network performance and potentially adjust routing decisions. The parameters P<sub>ij</sub> could represent various connection characteristics, such as bandwidth, latency, or cost.
The diagram highlights the importance of both routing information and traffic monitoring in ensuring efficient network operation. The grid structure of the outgoing links suggests a structured approach to network connectivity. The diagram is a high-level conceptual overview and does not delve into the specifics of routing algorithms or traffic analysis techniques. It is a visual aid for understanding the basic components and relationships within a network node.