## Diagram: Network Node Architecture and Connectivity
### Overview
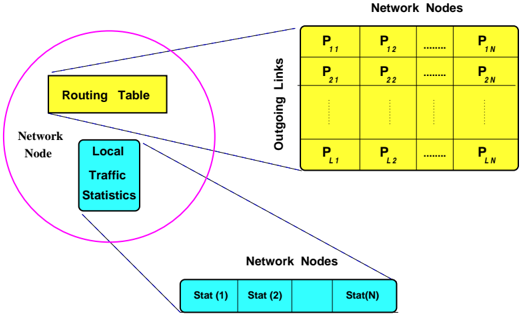
The diagram illustrates the structure and connectivity of a network node within a larger network. It highlights the routing table, local traffic statistics, outgoing links to other nodes, and the organization of network nodes in a grid-like structure. The visualization emphasizes how data flows and is managed within a network node.
### Components/Axes
1. **Central Elements**:
- **Routing Table**: A yellow rectangle labeled "Routing Table" at the center-left, acting as the decision-making hub for traffic routing.
- **Local Traffic Statistics**: A blue rectangle labeled "Local Traffic Statistics" below the routing table, tracking metrics like bandwidth usage or packet counts.
2. **Outgoing Links**:
- **Grid of Network Nodes**: A matrix of yellow rectangles labeled `P_ij` (e.g., `P_11`, `P_12`, ..., `P_LN`), representing connections to other nodes. The grid has `L` rows and `N` columns, with ellipses indicating omitted entries.
- **Outgoing Links**: Blue lines connecting the routing table to each `P_ij` node, symbolizing active data paths.
3. **Network Node Statistics**:
- **Stat(1), Stat(2), ..., Stat(N)**: Blue rectangles at the bottom, representing aggregated or individual metrics for network nodes. The ellipsis (`...`) suggests scalability beyond labeled entries.
4. **Legend**:
- **Yellow**: Routing Table and Outgoing Links (`P_ij`).
- **Blue**: Local Traffic Statistics and Network Node Statistics (`Stat(i)`).
### Detailed Analysis
- **Routing Table**: Positioned centrally, it is the focal point for managing traffic. Its yellow color distinguishes it as a critical decision-making component.
- **Outgoing Links (`P_ij`)**: The grid structure implies a systematic approach to routing, with each `P_ij` representing a potential connection to another node. The use of ellipses (`...`) indicates the diagram abstracts away less critical details for clarity.
- **Local Traffic Statistics**: Directly connected to the routing table, suggesting real-time data influences routing decisions.
- **Network Node Statistics**: The bottom row of `Stat(i)` entries implies monitoring of node performance, possibly for load balancing or fault detection.
### Key Observations
1. **Hierarchical Structure**: The routing table and local statistics are at the core, while outgoing links and node statistics form the periphery.
2. **Scalability**: The grid of `P_ij` nodes and `Stat(i)` entries suggests the architecture is designed for large-scale networks.
3. **Color Coding**: Yellow (routing/links) and blue (statistics) visually separate control-plane (routing) and data-plane (traffic) components.
### Interpretation
This diagram represents a network node's role in managing traffic flow and connectivity. The routing table acts as the brain, using local traffic data to determine optimal paths (via `P_ij` links) to other nodes. The grid of network nodes implies a structured, possibly mesh-like topology, where each node can connect to multiple peers. The inclusion of `Stat(i)` entries highlights the importance of monitoring node health and performance, which could feed back into the routing table for dynamic adjustments (e.g., avoiding congested paths). The abstraction via ellipses suggests the diagram prioritizes conceptual clarity over exhaustive detail, focusing on the node's functional role rather than specific implementation mechanics.