## Heatmap: Baseline - Core Generalization - Qwen-2.5 7B
### Overview
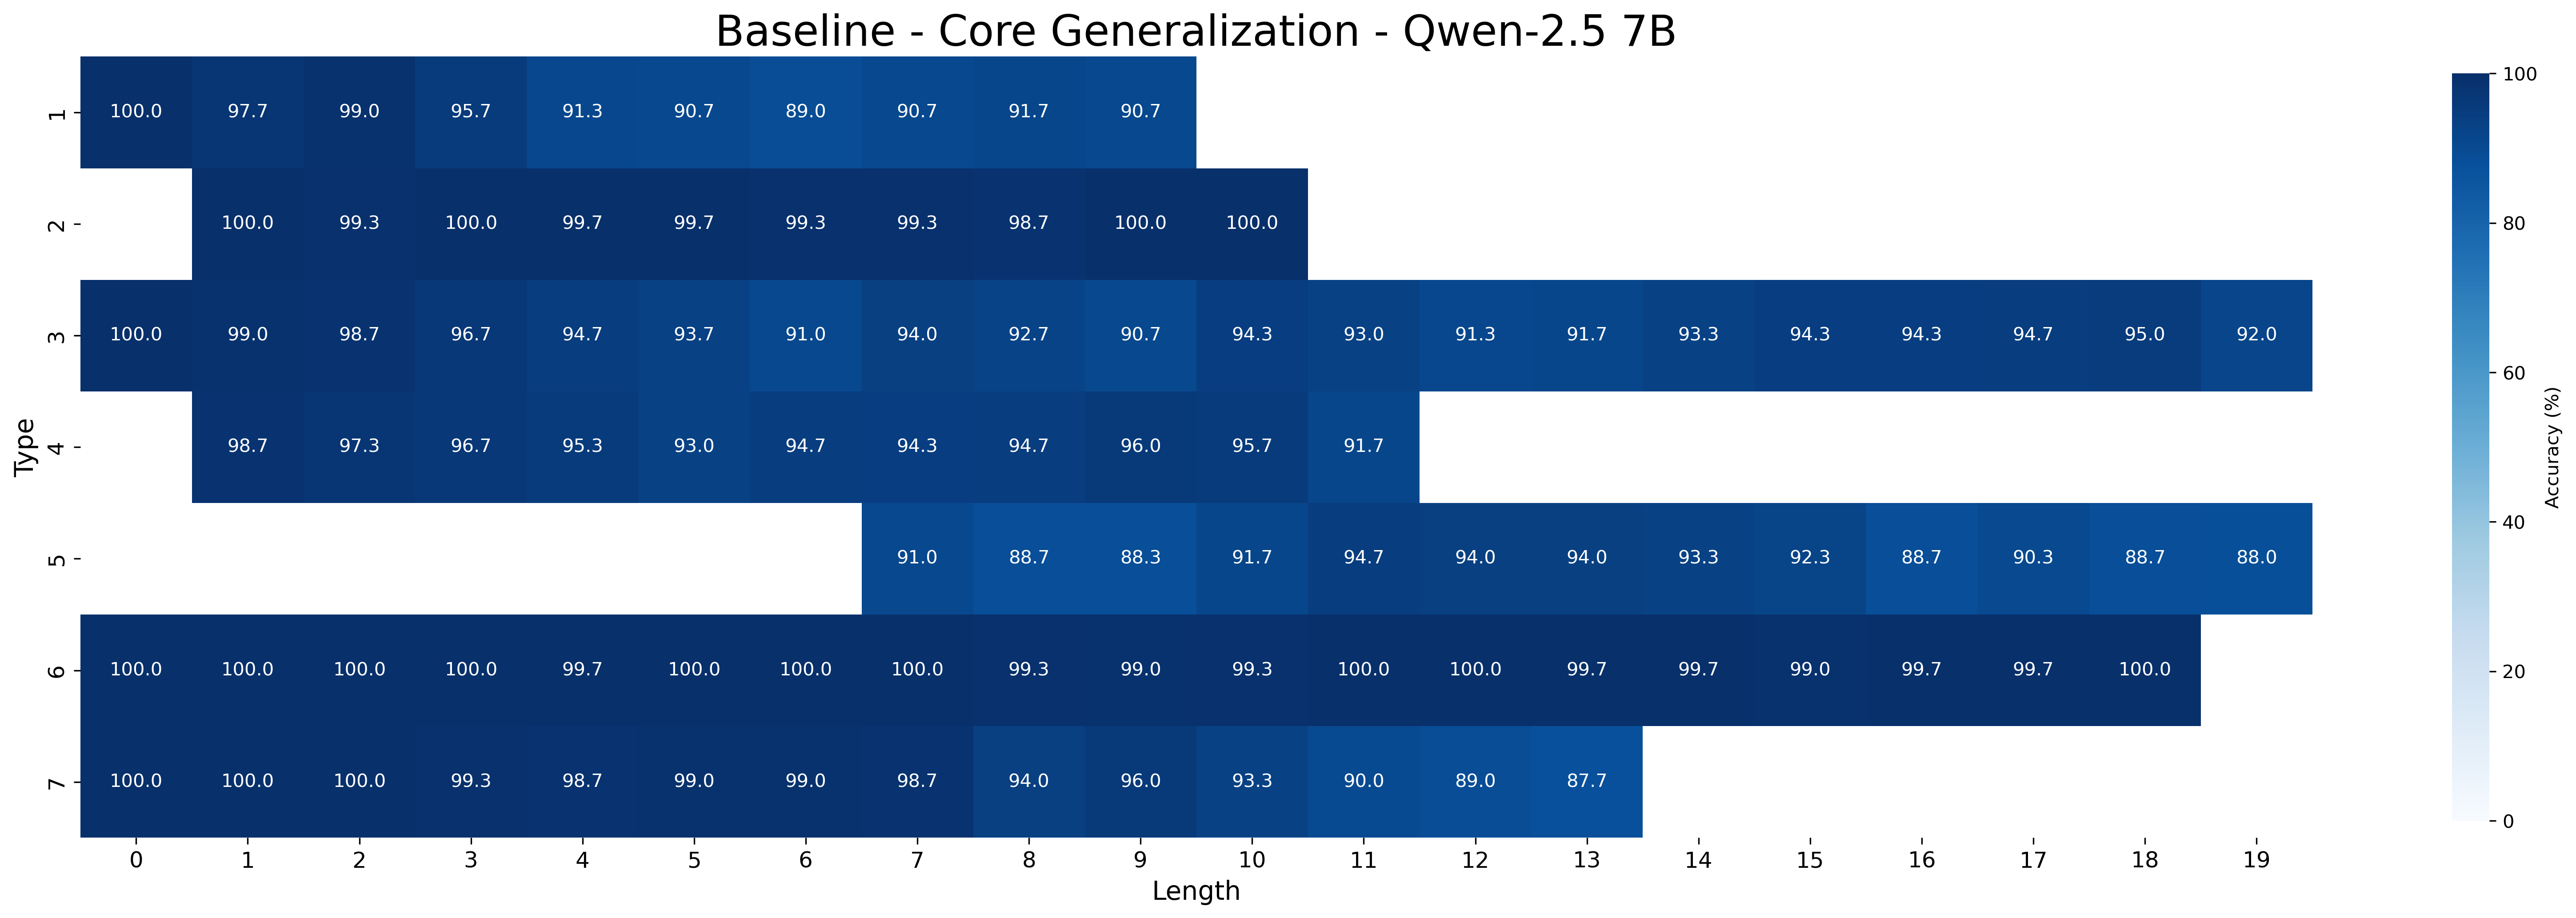
The image is a heatmap visualizing the accuracy of a model (Qwen-2.5 7B) on core generalization tasks. The heatmap displays accuracy percentages for different "Type" categories (1 to 7) across varying sequence "Length" (0 to 19). The color intensity represents the accuracy, with darker blue indicating higher accuracy and lighter blue indicating lower accuracy.
### Components/Axes
* **Title:** Baseline - Core Generalization - Qwen-2.5 7B
* **Y-axis:** "Type" labeled 1, 2, 3, 4, 5, 6, 7.
* **X-axis:** "Length" ranging from 0 to 19.
* **Colorbar (right side):** "Accuracy (%)" ranging from 0 to 100, with a gradient from light blue (0) to dark blue (100).
### Detailed Analysis
The heatmap presents accuracy values for each combination of "Type" and "Length". Here's a breakdown of the values:
* **Type 1:**
* Length 0: 100.0%
* Length 1: 97.7%
* Length 2: 99.0%
* Length 3: 95.7%
* Length 4: 91.3%
* Length 5: 90.7%
* Length 6: 89.0%
* Length 7: 90.7%
* Length 8: 91.7%
* Length 9: 90.7%
* **Type 2:**
* Length 0: 100.0%
* Length 1: 99.3%
* Length 2: 100.0%
* Length 3: 99.7%
* Length 4: 99.7%
* Length 5: 99.3%
* Length 6: 99.3%
* Length 7: 98.7%
* Length 8: 100.0%
* Length 9: 100.0%
* Length 10: 100.0%
* **Type 3:**
* Length 0: 100.0%
* Length 1: 99.0%
* Length 2: 98.7%
* Length 3: 96.7%
* Length 4: 94.7%
* Length 5: 93.7%
* Length 6: 91.0%
* Length 7: 94.0%
* Length 8: 92.7%
* Length 9: 90.7%
* Length 10: 94.3%
* Length 11: 93.0%
* Length 12: 91.3%
* Length 13: 91.7%
* Length 14: 93.3%
* Length 15: 94.3%
* Length 16: 94.3%
* Length 17: 94.7%
* Length 18: 95.0%
* Length 19: 92.0%
* **Type 4:**
* Length 0: 98.7%
* Length 1: 97.3%
* Length 2: 96.7%
* Length 3: 95.3%
* Length 4: 93.0%
* Length 5: 94.7%
* Length 6: 94.3%
* Length 7: 94.7%
* Length 8: 96.0%
* Length 9: 95.7%
* Length 10: 91.7%
* **Type 5:**
* Length 7: 91.0%
* Length 8: 88.7%
* Length 9: 88.3%
* Length 10: 91.7%
* Length 11: 94.7%
* Length 12: 94.0%
* Length 13: 94.0%
* Length 14: 93.3%
* Length 15: 92.3%
* Length 16: 88.7%
* Length 17: 90.3%
* Length 18: 88.7%
* Length 19: 88.0%
* **Type 6:**
* Length 0: 100.0%
* Length 1: 100.0%
* Length 2: 100.0%
* Length 3: 100.0%
* Length 4: 99.7%
* Length 5: 100.0%
* Length 6: 100.0%
* Length 7: 100.0%
* Length 8: 99.3%
* Length 9: 99.0%
* Length 10: 99.3%
* Length 11: 100.0%
* Length 12: 100.0%
* Length 13: 99.7%
* Length 14: 99.7%
* Length 15: 99.0%
* Length 16: 99.7%
* Length 17: 99.7%
* Length 18: 100.0%
* Length 19: 100.0%
* **Type 7:**
* Length 0: 100.0%
* Length 1: 100.0%
* Length 2: 100.0%
* Length 3: 99.3%
* Length 4: 98.7%
* Length 5: 99.0%
* Length 6: 99.0%
* Length 7: 98.7%
* Length 8: 94.0%
* Length 9: 96.0%
* Length 10: 93.3%
* Length 11: 90.0%
* Length 12: 89.0%
* Length 13: 87.7%
### Key Observations
* Types 6 and 7 generally exhibit very high accuracy across all lengths.
* Type 5 shows lower accuracy and starts later in the sequence length.
* Types 1, 3, and 4 show a decreasing trend in accuracy as the sequence length increases, especially noticeable after length 5.
* Type 2 maintains high accuracy across all lengths tested.
### Interpretation
The heatmap illustrates the performance of the Qwen-2.5 7B model on different types of core generalization tasks, with varying sequence lengths. The model demonstrates strong generalization capabilities for certain task types (6 and 7), maintaining near-perfect accuracy even with longer sequences. However, for other task types (1, 3, 4, and 5), the accuracy decreases as the sequence length increases, suggesting that the model struggles to generalize as the input becomes more complex. Type 5 is a clear outlier, with lower accuracy and a later start, indicating a specific challenge for this task type. The data suggests that the model's performance is highly dependent on the specific task and its complexity, as represented by the sequence length.