## Heatmap: Baseline - Core Generalization - Qwen-2.5 7B
### Overview
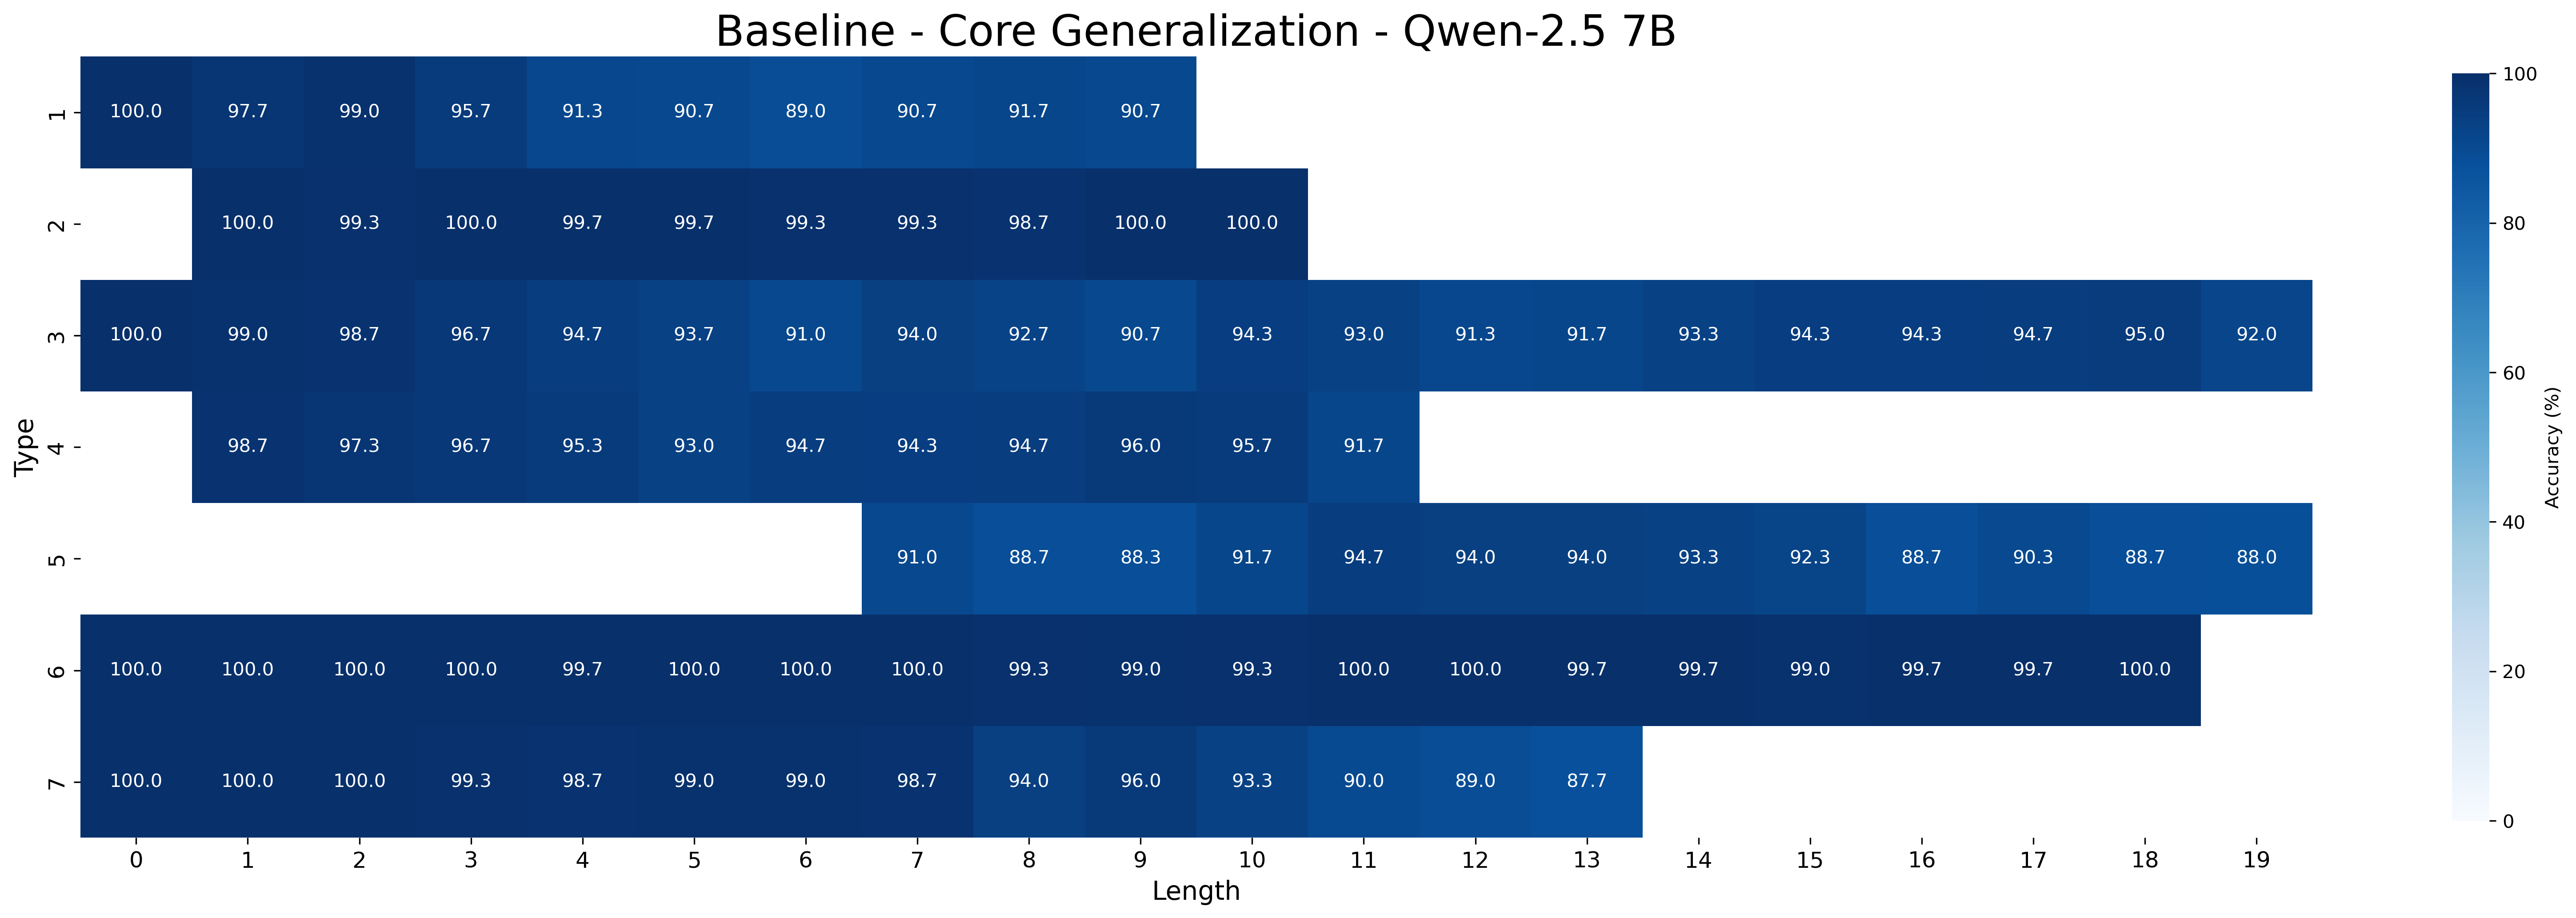
This image is a heatmap visualizing the accuracy performance of the "Qwen-2.5 7B" model on a "Core Generalization" task. The chart plots performance across two dimensions: "Type" (vertical axis) and "Length" (horizontal axis). The color intensity of each cell represents the accuracy percentage, with a corresponding color bar legend on the right. The data appears to be from a baseline evaluation.
### Components/Axes
* **Title:** "Baseline - Core Generalization - Qwen-2.5 7B" (centered at the top).
* **Vertical Axis (Y-axis):** Labeled "Type". It contains 7 discrete categories, numbered 1 through 7 from top to bottom.
* **Horizontal Axis (X-axis):** Labeled "Length". It contains 20 discrete categories, numbered 0 through 19 from left to right.
* **Color Bar Legend:** Positioned vertically on the far right of the chart. It is labeled "Accuracy (%)" and shows a gradient from light blue (0%) to dark blue (100%), with tick marks at 0, 20, 40, 60, 80, and 100.
* **Data Grid:** The main body of the chart is a grid of colored cells. Each cell contains a numerical value representing the accuracy percentage for a specific (Type, Length) combination. White cells indicate missing data or a value of 0% (though the color bar suggests 0% is very light blue, not white).
### Detailed Analysis
The following table reconstructs the data from the heatmap. "N/A" denotes a white cell with no numerical value.
| Type \ Length | 0 | 1 | 2 | 3 | 4 | 5 | 6 | 7 | 8 | 9 | 10 | 11 | 12 | 13 | 14 | 15 | 16 | 17 | 18 | 19 |
| :--- | :--- | :--- | :--- | :--- | :--- | :--- | :--- | :--- | :--- | :--- | :--- | :--- | :--- | :--- | :--- | :--- | :--- | :--- | :--- | :--- |
| **1** | 100.0 | 97.7 | 99.0 | 95.7 | 91.3 | 90.7 | 89.0 | 90.7 | 91.7 | 90.7 | N/A | N/A | N/A | N/A | N/A | N/A | N/A | N/A | N/A | N/A |
| **2** | N/A | 100.0 | 99.3 | 100.0 | 99.7 | 99.7 | 99.3 | 99.3 | 98.7 | 100.0 | 100.0 | N/A | N/A | N/A | N/A | N/A | N/A | N/A | N/A | N/A |
| **3** | 100.0 | 99.0 | 98.7 | 96.7 | 94.7 | 93.7 | 91.0 | 94.0 | 92.7 | 90.7 | 94.3 | 93.0 | 91.3 | 91.7 | 93.3 | 94.3 | 94.3 | 94.7 | 95.0 | 92.0 |
| **4** | N/A | 98.7 | 97.3 | 96.7 | 95.3 | 93.0 | 94.7 | 94.3 | 94.7 | 96.0 | 95.7 | 91.7 | N/A | N/A | N/A | N/A | N/A | N/A | N/A | N/A |
| **5** | N/A | N/A | N/A | N/A | N/A | N/A | N/A | 91.0 | 88.7 | 88.3 | 91.7 | 94.7 | 94.0 | 94.0 | 93.3 | 92.3 | 88.7 | 90.3 | 88.7 | 88.0 |
| **6** | 100.0 | 100.0 | 100.0 | 100.0 | 99.7 | 100.0 | 100.0 | 100.0 | 99.3 | 99.0 | 99.3 | 100.0 | 100.0 | 99.7 | 99.7 | 99.0 | 99.7 | 99.7 | 100.0 | N/A |
| **7** | 100.0 | 100.0 | 100.0 | 99.3 | 98.7 | 99.0 | 99.0 | 98.7 | 94.0 | 96.0 | 93.3 | 90.0 | 89.0 | 87.7 | N/A | N/A | N/A | N/A | N/A | N/A |
### Key Observations
1. **High Overall Performance:** The majority of the recorded accuracy values are above 90%, with many cells at or near 100%. The darkest blue cells (highest accuracy) are concentrated in the top-left and middle sections of the chart.
2. **Performance by Type:**
* **Type 6** demonstrates the most consistent and highest performance, maintaining accuracy between 99.0% and 100.0% across all measured lengths (0-18).
* **Type 2** also shows excellent performance (98.7%-100.0%) but only for lengths 1-10.
* **Type 5** has the most limited data range (Lengths 7-19) and shows a slight downward trend, with its lowest accuracy (88.0%) at the maximum length (19).
* **Type 7** shows a clear performance degradation as length increases, starting at 100% for lengths 0-2 and dropping to 87.7% by length 13.
3. **Performance by Length:** There is no universal trend of accuracy decreasing with length. Some types (e.g., Type 6) are unaffected. Others (e.g., Type 7) show a decline. Type 3 shows a slight dip in the middle lengths (6-9) before recovering.
4. **Data Sparsity:** The heatmap is not fully populated. Significant gaps exist:
* **Type 1:** No data for Lengths 10-19.
* **Type 2:** No data for Length 0 and Lengths 11-19.
* **Type 4:** No data for Length 0 and Lengths 12-19.
* **Type 5:** No data for Lengths 0-6.
* **Type 6:** No data for Length 19.
* **Type 7:** No data for Lengths 14-19.
### Interpretation
This heatmap provides a granular view of the Qwen-2.5 7B model's generalization capabilities. The "Type" axis likely represents different categories or difficulty levels of the core generalization task, while "Length" probably corresponds to the sequence length or complexity of the input.
The data suggests the model is highly robust for certain task types (notably Type 6) across varying lengths. The performance degradation observed in Type 7 indicates a specific vulnerability where increased length negatively impacts accuracy. The sparse data for higher lengths in several types (1, 2, 4, 7) could imply that testing was not conducted for those combinations, or that the model failed to produce valid outputs (resulting in no accuracy score).
The primary takeaway is that the model's generalization performance is not uniform; it is highly dependent on the specific type of task and, for some types, the length of the input. This analysis would be crucial for identifying the model's strengths and weaknesses, guiding further fine-tuning, or determining its suitability for specific applications that require handling long sequences of a particular type.