# Technical Document Extraction: Baseline - Core Generalization - Qwen-2.5 7B
## Chart Description
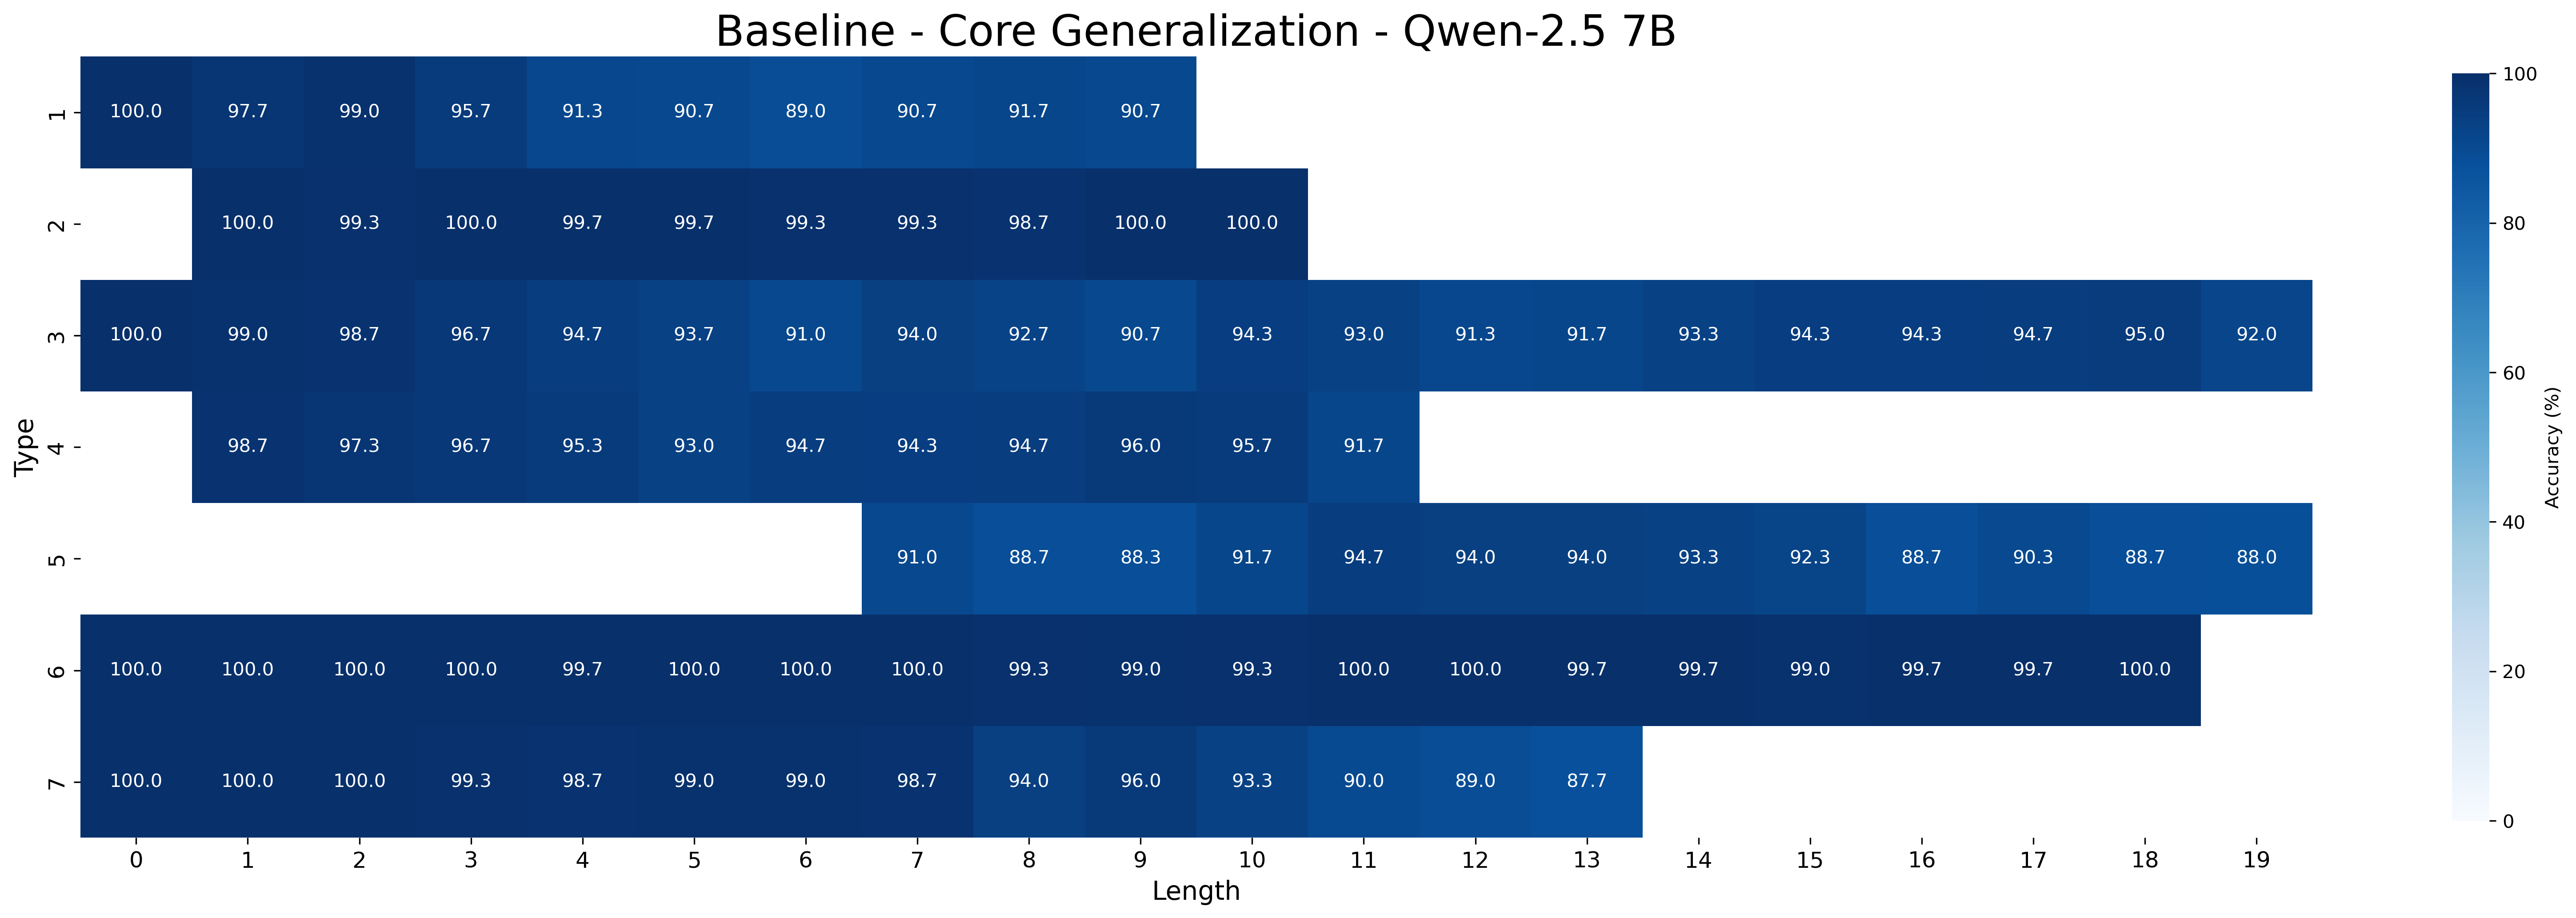
This image is a **heatmap** visualizing accuracy percentages across different model types and input lengths. The chart uses a **blue gradient color scale** (0% to 100%) to represent accuracy, with darker blue indicating higher accuracy.
---
### Axis Labels and Markers
- **X-axis (Horizontal):**
- Label: `Length`
- Values: `0` to `19` (integer increments)
- Spatial grounding: `[x, y]` placement: `[0, 0]` to `[19, 0]`
- **Y-axis (Vertical):**
- Label: `Type`
- Values: `1` to `7` (integer increments)
- Spatial grounding: `[x, y]` placement: `[0, 1]` to `[0, 7]`
- **Colorbar (Legend):**
- Label: `Accuracy (%)`
- Range: `0%` (light blue) to `100%` (dark blue)
- Spatial grounding: `[x, y]` placement: `[20, 0]` to `[20, 7]`
---
### Data Structure
The heatmap contains **7 rows (Types)** and **20 columns (Lengths)**. Each cell represents the accuracy percentage for a specific `(Type, Length)` pair. Below is the reconstructed data table:
| Type \ Length | 0 | 1 | 2 | 3 | 4 | 5 | 6 | 7 | 8 | 9 | 10 | 11 | 12 | 13 | 14 | 15 | 16 | 17 | 18 | 19 |
|---------------|------|------|------|------|------|------|------|------|------|------|------|------|------|------|------|------|------|------|------|------|
| 1 | 100.0| 97.7 | 99.0 | 95.7 | 91.3 | 90.7 | 89.0 | 90.7 | 91.7 | 90.7 | | | | | | | | | | |
| 2 | | 100.0| 99.3 | 100.0| 99.7 | 99.7 | 99.3 | 99.3 | 98.7 | 100.0| 100.0| | | | | | | | | |
| 3 | 100.0| 99.0 | 98.7 | 96.7 | 94.7 | 93.7 | 91.0 | 94.0 | 92.7 | 90.7 | 94.3 | 93.0 | 91.3 | 91.7 | 93.3 | 94.3 | 94.3 | 94.7 | 95.0 | 92.0 |
| 4 | | 98.7 | 97.3 | 96.7 | 95.3 | 93.0 | 94.7 | 94.3 | 94.7 | 96.0 | 95.7 | 91.7 | | | | | | | | |
| 5 | | | | | | | 91.0 | 88.7 | 88.3 | 91.7 | 94.7 | 94.0 | 94.0 | 94.0 | 93.3 | 92.3 | 88.7 | 90.3 | 88.7 | 88.0 |
| 6 | 100.0| 100.0| 100.0| 100.0| 99.7 | 100.0| 100.0| 100.0| 99.3 | 99.0 | 99.3 | 100.0| 100.0| 99.7 | 99.7 | 99.0 | 99.7 | 99.7 | 100.0| |
| 7 | 100.0| 100.0| 100.0| 99.3 | 98.7 | 99.0 | 99.0 | 98.7 | 94.0 | 96.0 | 93.3 | 90.0 | 89.0 | 87.7 | | | | | | |
---
### Key Trends and Observations
1. **Type 1:**
- Accuracy starts at **100%** (Length 0) but declines sharply to **89.0%** (Length 6).
- Further drops to **90.7%** (Length 7) and stabilizes around **90-91%** for longer lengths.
2. **Type 2:**
- Maintains **100%** accuracy for Lengths 1-3.
- Slight decline to **99.3%** (Length 4) and stabilizes at **98.7-100%** for longer lengths.
3. **Type 3:**
- Gradual decline from **100%** (Length 0) to **92.0%** (Length 19).
- Notable drop to **90.7%** (Length 9) and **91.3%** (Length 12).
4. **Type 4:**
- Starts at **98.7%** (Length 1) and fluctuates between **93.0-96.0%** for mid-lengths.
- Drops to **91.7%** (Length 11) and stabilizes at **94.7-95.7%** for longer lengths.
5. **Type 5:**
- Starts at **91.0%** (Length 6) and declines to **88.0%** (Length 19).
- Sharp drop to **88.3%** (Length 8) and **88.7%** (Length 16).
6. **Type 6:**
- Maintains **100%** accuracy for Lengths 0-6.
- Slight decline to **99.0%** (Length 9) and stabilizes at **99.7-100%** for longer lengths.
7. **Type 7:**
- Starts at **100%** (Length 0) and declines sharply to **87.7%** (Length 13).
- Further drops to **89.0%** (Length 12) and **90.0%** (Length 11).
---
### Color Legend Verification
- **Dark Blue (100%):** Confirmed for Type 1 (Length 0), Type 2 (Length 1-3), Type 3 (Length 0), Type 6 (Length 0-6), and Type 7 (Length 0).
- **Medium Blue (90-95%):** Matches Type 1 (Length 7-8), Type 3 (Length 7-10), Type 4 (Length 7-10), and Type 5 (Length 6-7).
- **Light Blue (87-90%):** Matches Type 5 (Length 16-19), Type 7 (Length 11-13).
---
### Spatial Component Isolation
1. **Header:**
- Title: `Baseline - Core Generalization - Qwen-2.5 7B`
- Position: Top center of the chart.
2. **Main Chart:**
- Heatmap grid with labeled rows (Types) and columns (Lengths).
- Position: Center of the image.
3. **Legend:**
- Colorbar with `Accuracy (%)` label.
- Position: Right side of the chart.
---
### Final Notes
- All numerical values are extracted directly from the heatmap cells.
- No additional text or non-English content is present.
- The chart focuses on quantifying model performance degradation as input length increases.