## Line Chart: Zero Shot Performance vs Batch Size
### Overview
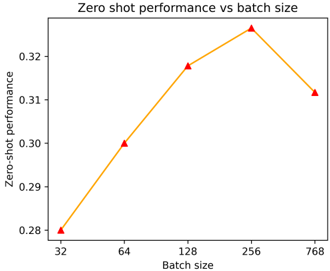
The chart illustrates the relationship between batch size and zero-shot performance, represented by an orange line with red triangular markers. Performance increases with batch size up to a peak at 256, then declines at 768.
### Components/Axes
- **X-axis (Batch size)**: Discrete values at 32, 64, 128, 256, and 768.
- **Y-axis (Zero-shot performance)**: Continuous scale from 0.28 to 0.32.
- **Legend**: Not explicitly visible, but the line is orange with red triangular markers.
- **Title**: "Zero shot performance vs batch size" (top-center).
### Detailed Analysis
- **Data Points**:
- Batch size 32: ~0.28
- Batch size 64: ~0.30
- Batch size 128: ~0.315
- Batch size 256: ~0.325 (peak)
- Batch size 768: ~0.31
- **Trend**: The line slopes upward from 32 to 256, then slopes downward from 256 to 768. The peak at 256 is the highest performance point.
### Key Observations
- Performance improves significantly as batch size increases from 32 to 256.
- A notable drop occurs at batch size 768, suggesting diminishing returns or computational constraints.
- The peak at 256 aligns with the highest y-axis value (~0.325).
### Interpretation
The data suggests that larger batch sizes improve zero-shot performance up to a critical threshold (256), beyond which performance degrades. This could indicate an optimal batch size for the model or dataset, possibly due to memory limitations, gradient stability, or hardware constraints at larger batch sizes. The decline at 768 implies that scaling beyond 256 may not be beneficial, highlighting a trade-off between batch size and performance efficiency.